
Interactive Results
Rotate 3D structures, explore UMAPs and tissue maps, and read diagrams of your analysis, right inside Drylab.
Not every result is a flat picture. Drylab can show 3D protein structures you can turn, UMAPs and tissue maps you can zoom into and select from, and diagrams that lay out the steps of your analysis. You explore them in the chat or in the side panel, with nothing to install.
| You see | When | What you can do |
|---|---|---|
| 3D structure | You open a structure file, or a workflow asks you to review one | Rotate, zoom, change the style, pick residues |
| UMAP / embedding plot | A workflow asks you to review cells | Hover, zoom, hide clusters, select cells |
| Tissue map | A spatial workflow asks you to review spots | Color by domain or by value, select a region |
| Diagram | Drylab explains a workflow or the steps it ran | Expand, zoom, download as SVG, copy the source |
3D structures
Open a structure file from the chat's file list, or click its name in a Drylab message. It opens in the 3D viewer, in a tab in the side panel.
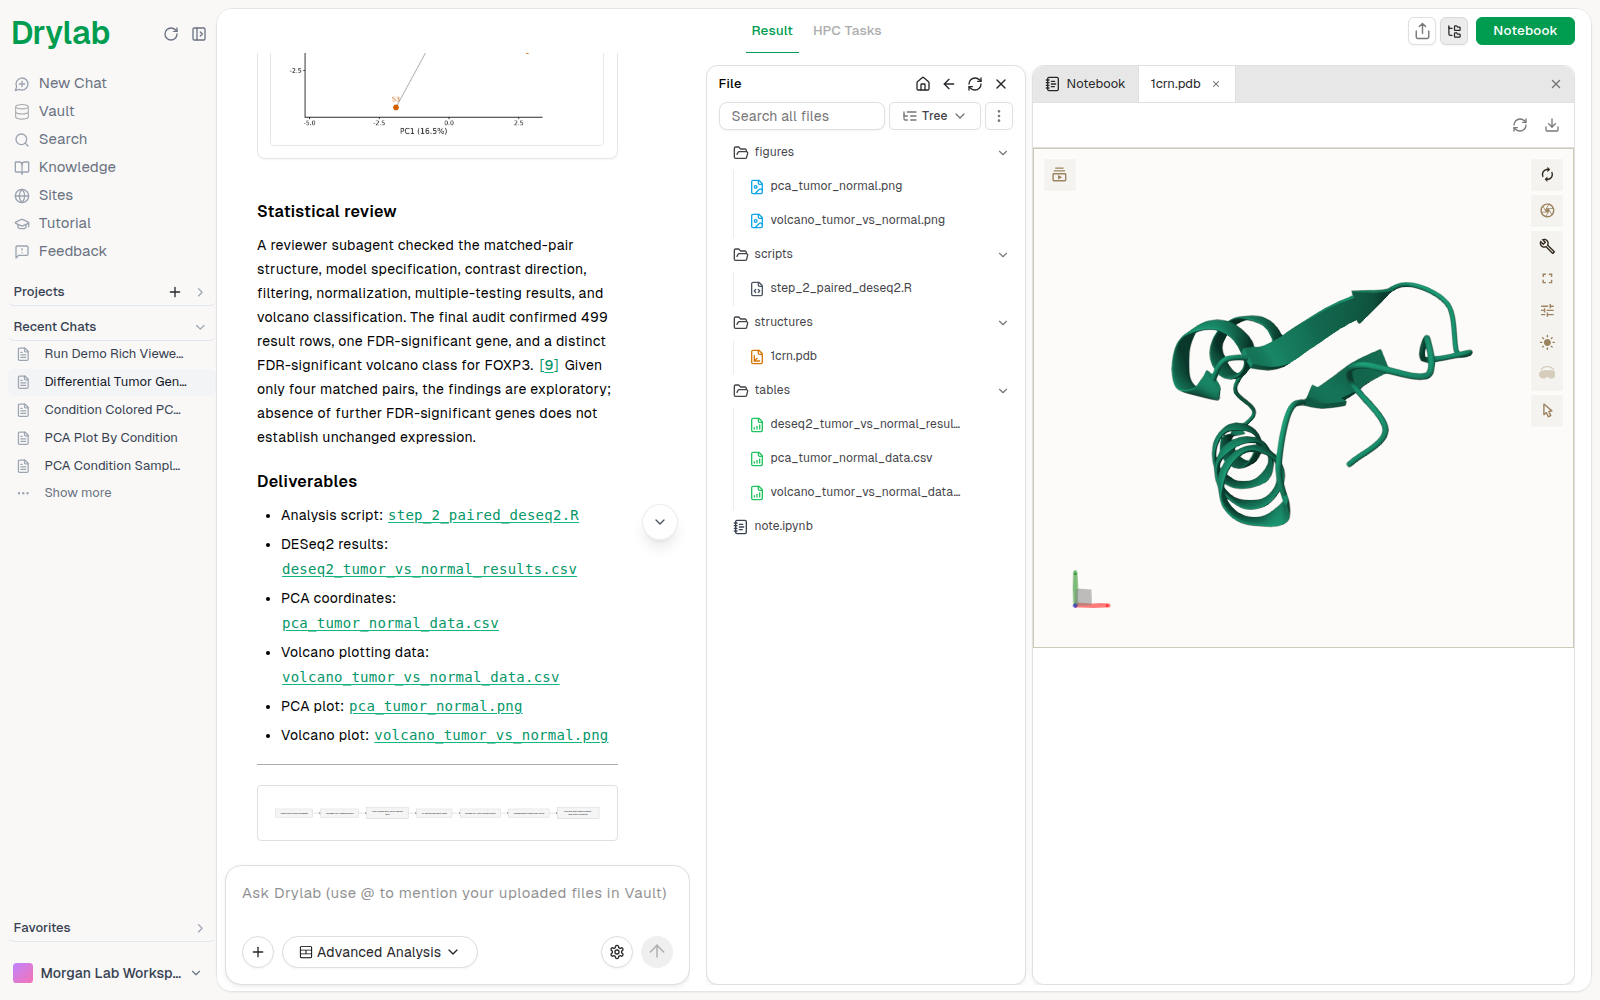
- Drag to rotate, scroll to zoom, and right-drag to move the structure.
- Use the buttons on the right of the viewer to reset the view, take a snapshot or expand the viewer. To change the style (for example cartoon or spacefill), open the controls panel with Toggle Controls Panel.
- The viewer opens PDB, PDBQT, mmCIF, SDF, MOL, MOL2, XYZ and GRO files.
Structures predicted or docked by accelerated tools, such as Boltz2 or DiffDock, open the same way.
Make a decision on an interactive view
Some steps need you to look at the data and choose, especially in structured workflows. Drylab pauses with a Decision needed card that holds the interactive view, with the default already set. Explore, adjust the selection if you want, and click Continue.
UMAP and other embeddings
The card shows each cell as a point, colored by cluster.
- Hover a point to see its label. Use the zoom tools at the top right of the plot to zoom in and out.
- Click a cluster in the legend to hide or show it.
- Drag on the plot to lasso a group of cells, or use the Box Select and Lasso Select tools at the top right. The card counts how many points you selected.
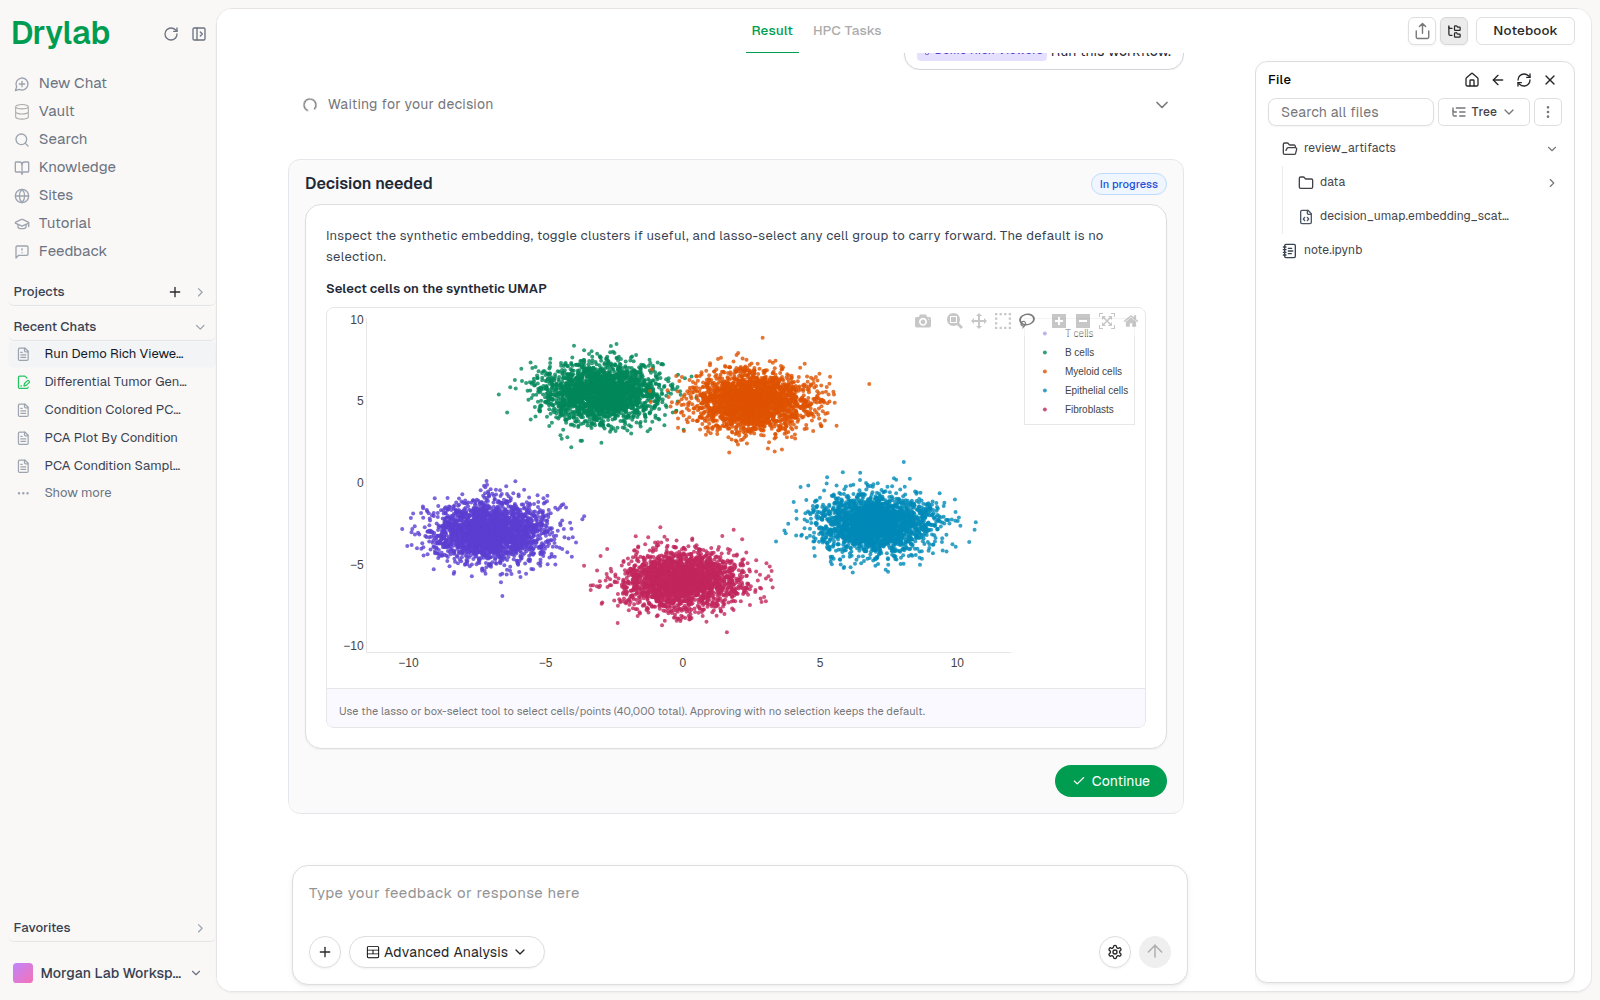
If you don't select anything, Drylab keeps the default and carries on.
Tissue maps
For spatial data, the card places each spot on the tissue. When both are available, use Color by to switch between Domain (the region each spot belongs to) and a value such as the expression of one gene. Select a region with Box Select or Lasso Select; the card counts the spots you selected.
3D structures in a decision
When a step asks about a structure, the card shows it in the 3D viewer and lists the residues of interest under it, by chain and number (for example A:44). Rotate the structure to inspect them, click the residues you want to include, then click Continue.
Diagrams
When Drylab explains a workflow or summarizes the steps it ran, it can draw a diagram in its answer, such as a flowchart or a Gantt chart. Hover the diagram to show its buttons:
| Button | What it does |
|---|---|
| Expand diagram | Open the diagram full screen, with Zoom in, Zoom out and Reset |
| Download SVG | Save the diagram as an image you can put in slides or a paper |
| Copy diagram source | Copy the text the diagram is drawn from, to edit or reuse it |
Long diagrams can look small in the chat. Click Expand diagram to read them at full size.
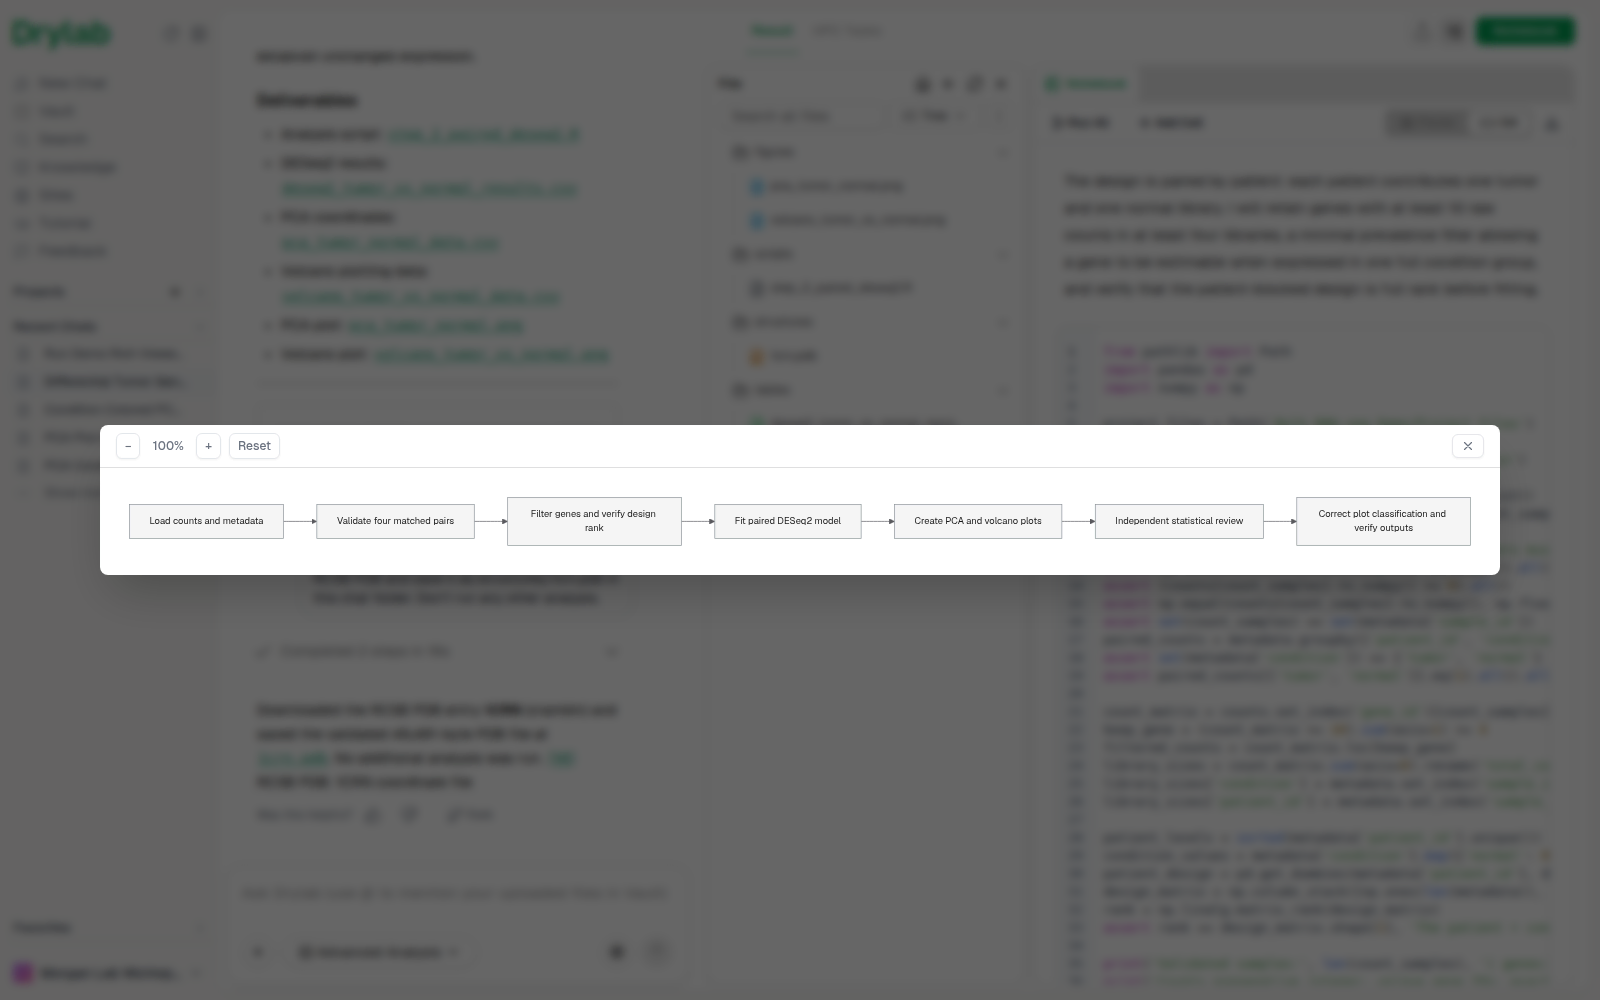
You can ask for one at any time, for example "Draw a flowchart of the steps you ran" or "Show the study design as a diagram".