
Edit Figures
Change titles, colours, axes and annotations on a figure Drylab made, then save it back to your chat.
When Drylab draws a plot, you can polish it yourself in the figure editor: change text and colours, adjust axes, add reference lines, then save. You don't need to touch the code or ask for a new run.
Which figures you can edit
Figure cards in a chat show an Edit button when the figure can be opened in the editor. This works for plots Drylab draws with matplotlib, including libraries built on it such as seaborn. Drylab can't open every plot in the editor, so check the card: other image figures only show Mention and See code, and interactive charts show Fullscreen and See code.
If an image figure has no Edit button, use Mention to ask Drylab to change it instead.
Open a figure in the editor
- In the chat, find the figure card.
- Click Edit (tooltip: "Open in the interactive figure editor").
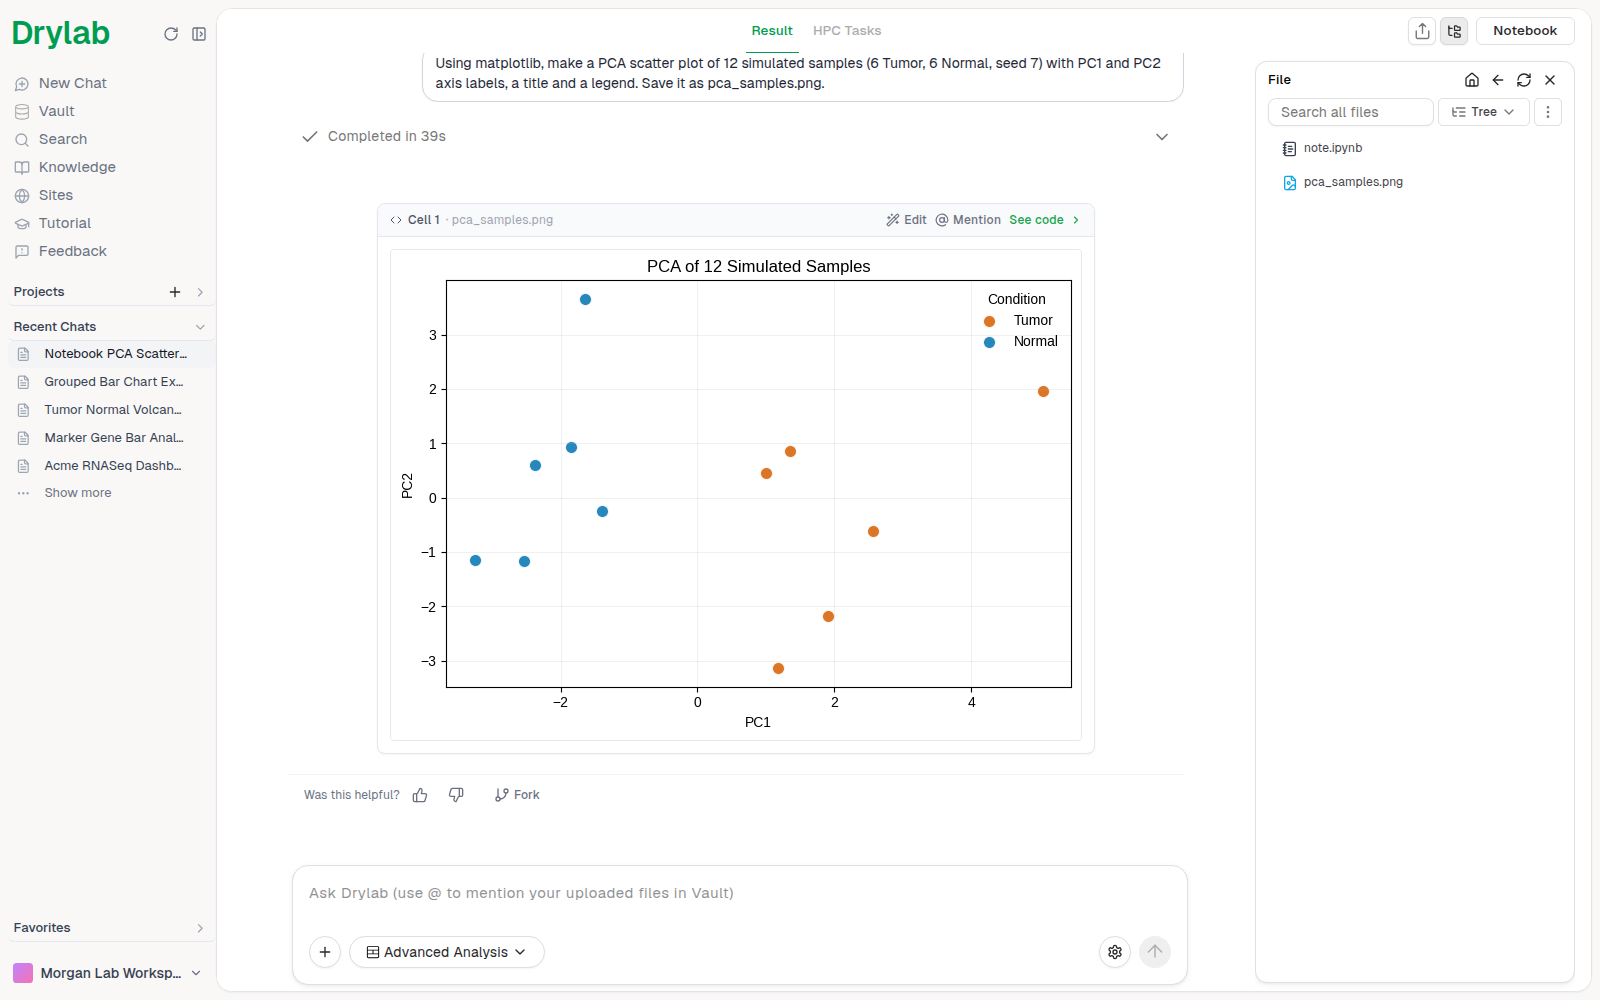
The editor opens over the chat, with the figure in the middle and a toolbar along the top.
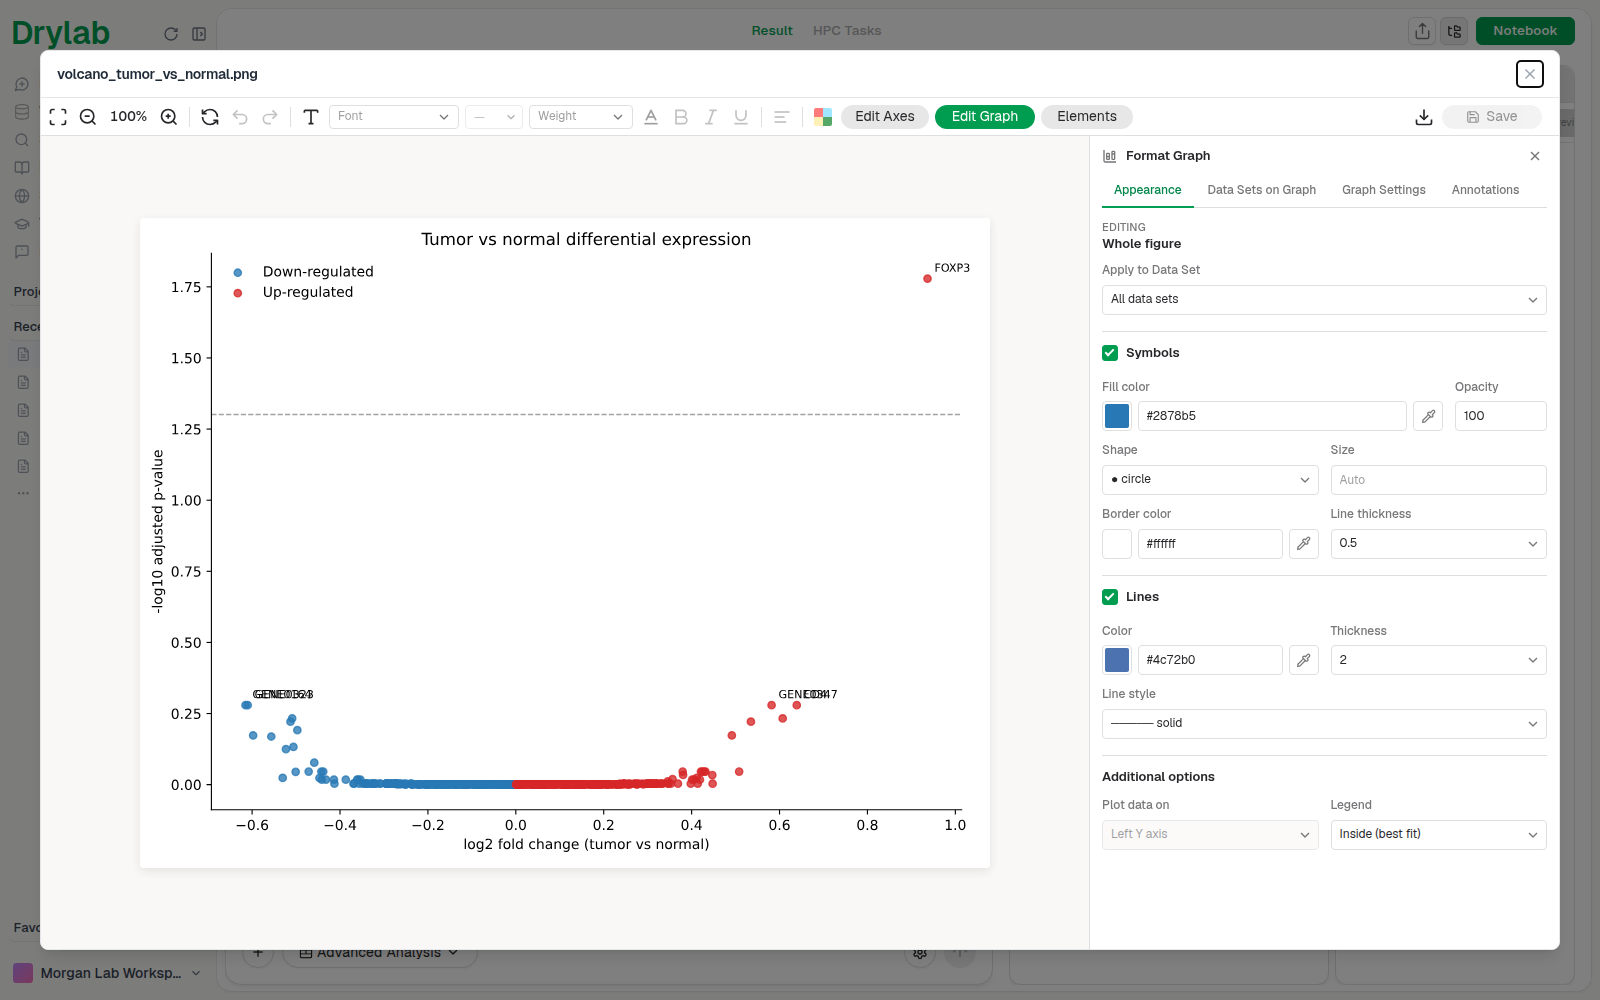
| Toolbar | What it does |
|---|---|
| Zoom and fit | Zoom in and out, or fit the whole figure on screen |
| Reset | Discard every change and restore the figure |
| Undo / Redo | Step back or forward through your edits |
| Text tools | Add a text label, or change the font, size, weight, colour, bold, italic and alignment of the selected text |
| Colour scheme | Recolour every data set at once |
| Edit Axes | Axis ranges, ticks, frame, grid and titles |
| Edit Graph | Restyle whole data sets: colours, symbols, error bars and lines |
| Elements | List every element on the chart and pick one to edit |
| Download | Download the figure as a PNG |
| Save | Save your changes to the figure |
Change any element
Click an element on the chart, such as the title, a legend or a data series. The Format Element panel opens on the right with that element's settings.
To change text, edit the Text field in the panel, or double-click the text on the chart and type. Use the toolbar to change its font, size, colour, bold or italic.
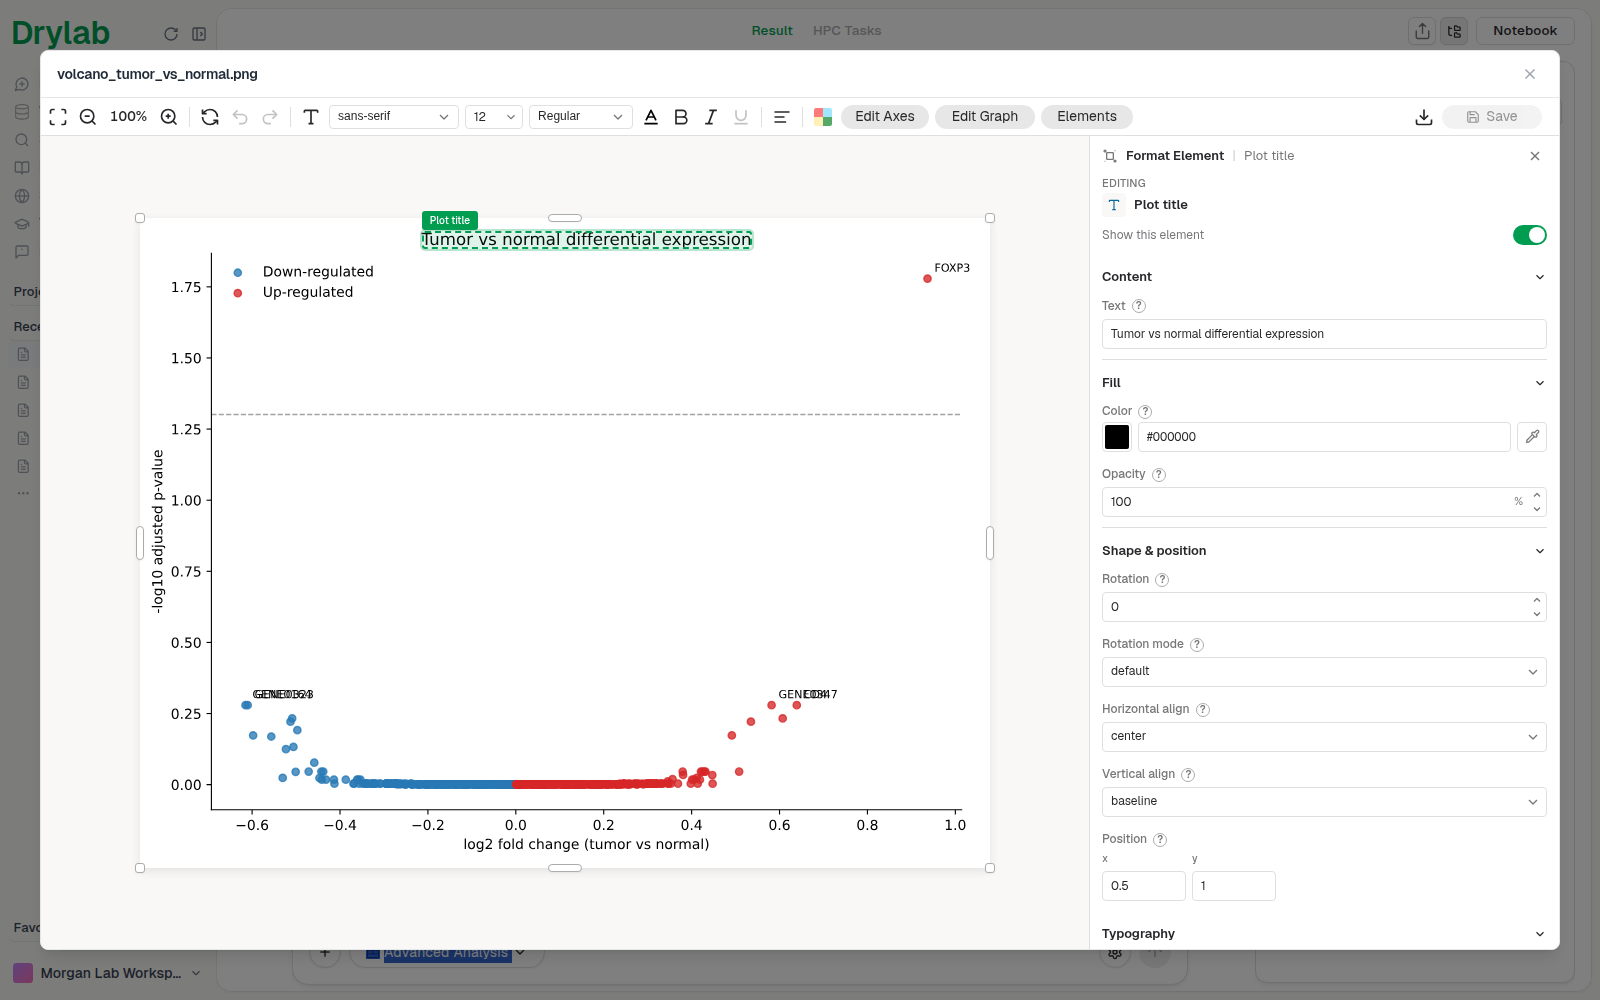
Elements that are hard to click, such as a single tick label, are listed in Elements.
Recolour the data
Click the colour scheme button in the toolbar and pick a scheme, such as Viridis, to recolour every data set at once. You can also choose Create Color Palette to save your own colours.
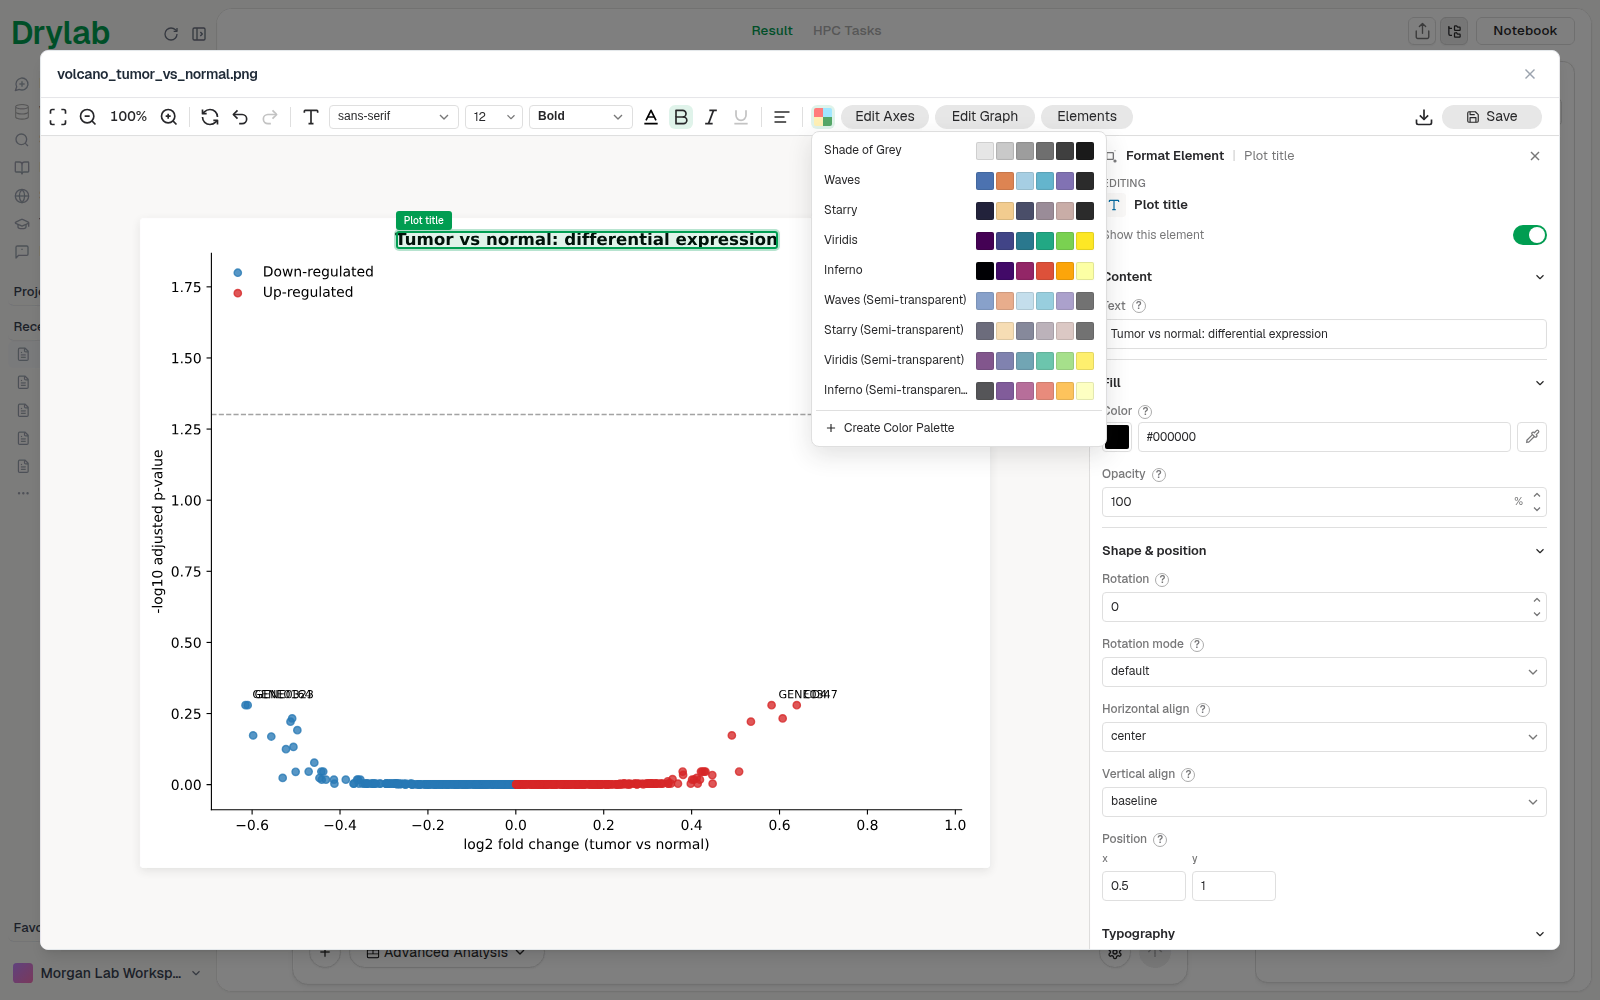
To change one data set only, open Edit Graph and use the Data Sets on Graph tab, or click the data set on the chart.
Adjust the axes
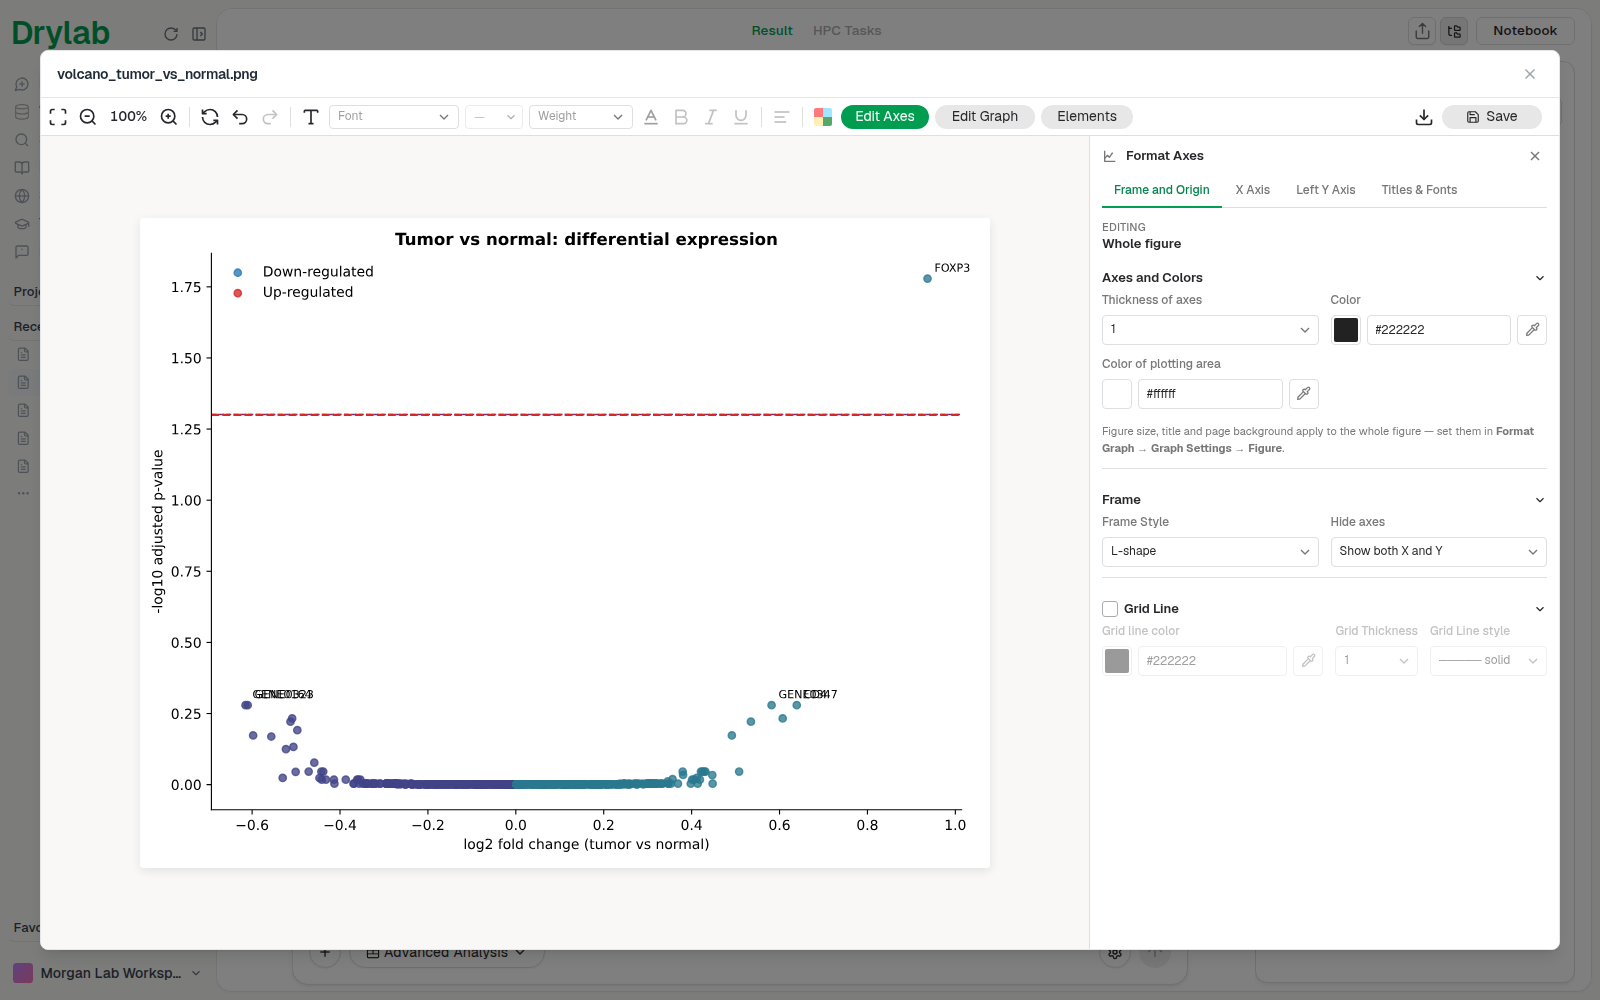
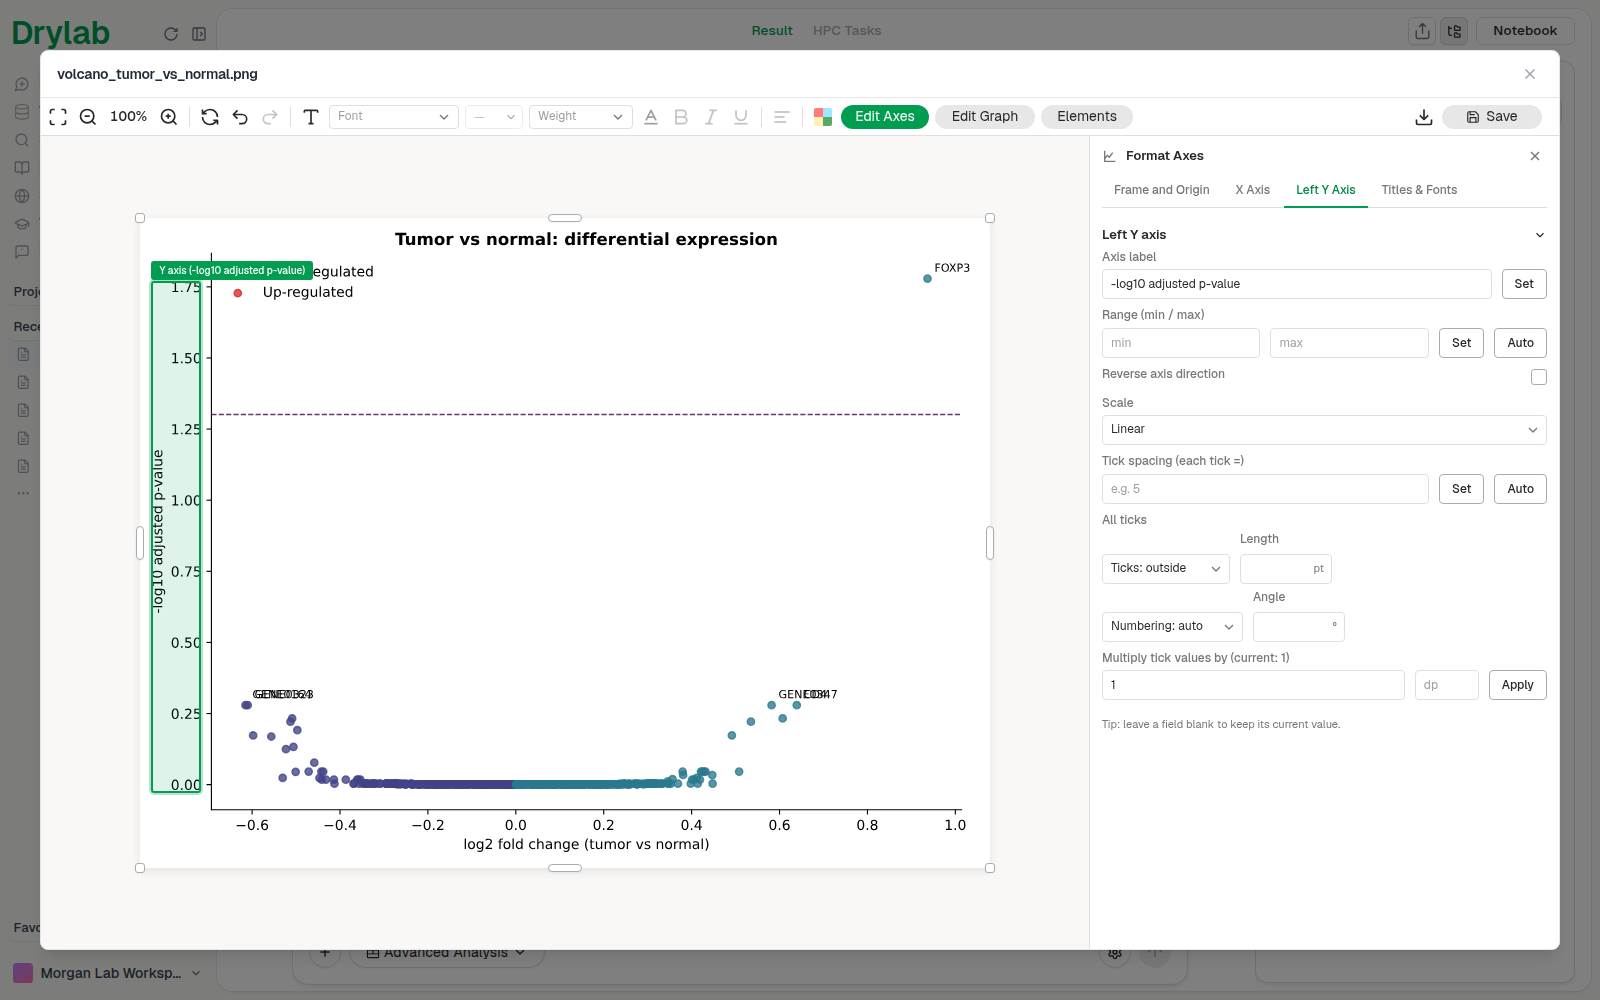
Click Edit Axes, or click an axis on the chart, to open Format Axes. It has these tabs:
| Tab | What you can change |
|---|---|
| Frame and Origin | Axis thickness and colour, frame style (Plain Frame, L-shape or No Frame), grid lines |
| X Axis / Left Y Axis | Range (min / max), scale (linear, logarithmic and more), tick spacing, tick direction, number format |
| Titles & Fonts | Graph title, axis titles, fonts and sizes |
Add reference lines and labels
- Click an axis on the chart to select it.
- Click Edit Graph, then the Annotations tab.
- Under Insert, choose what to add: a horizontal or vertical reference line or band, a text label, an arrow annotation, a confidence band or a trendline.
- Enter the position in data units, pick a colour, then click Add to chart.
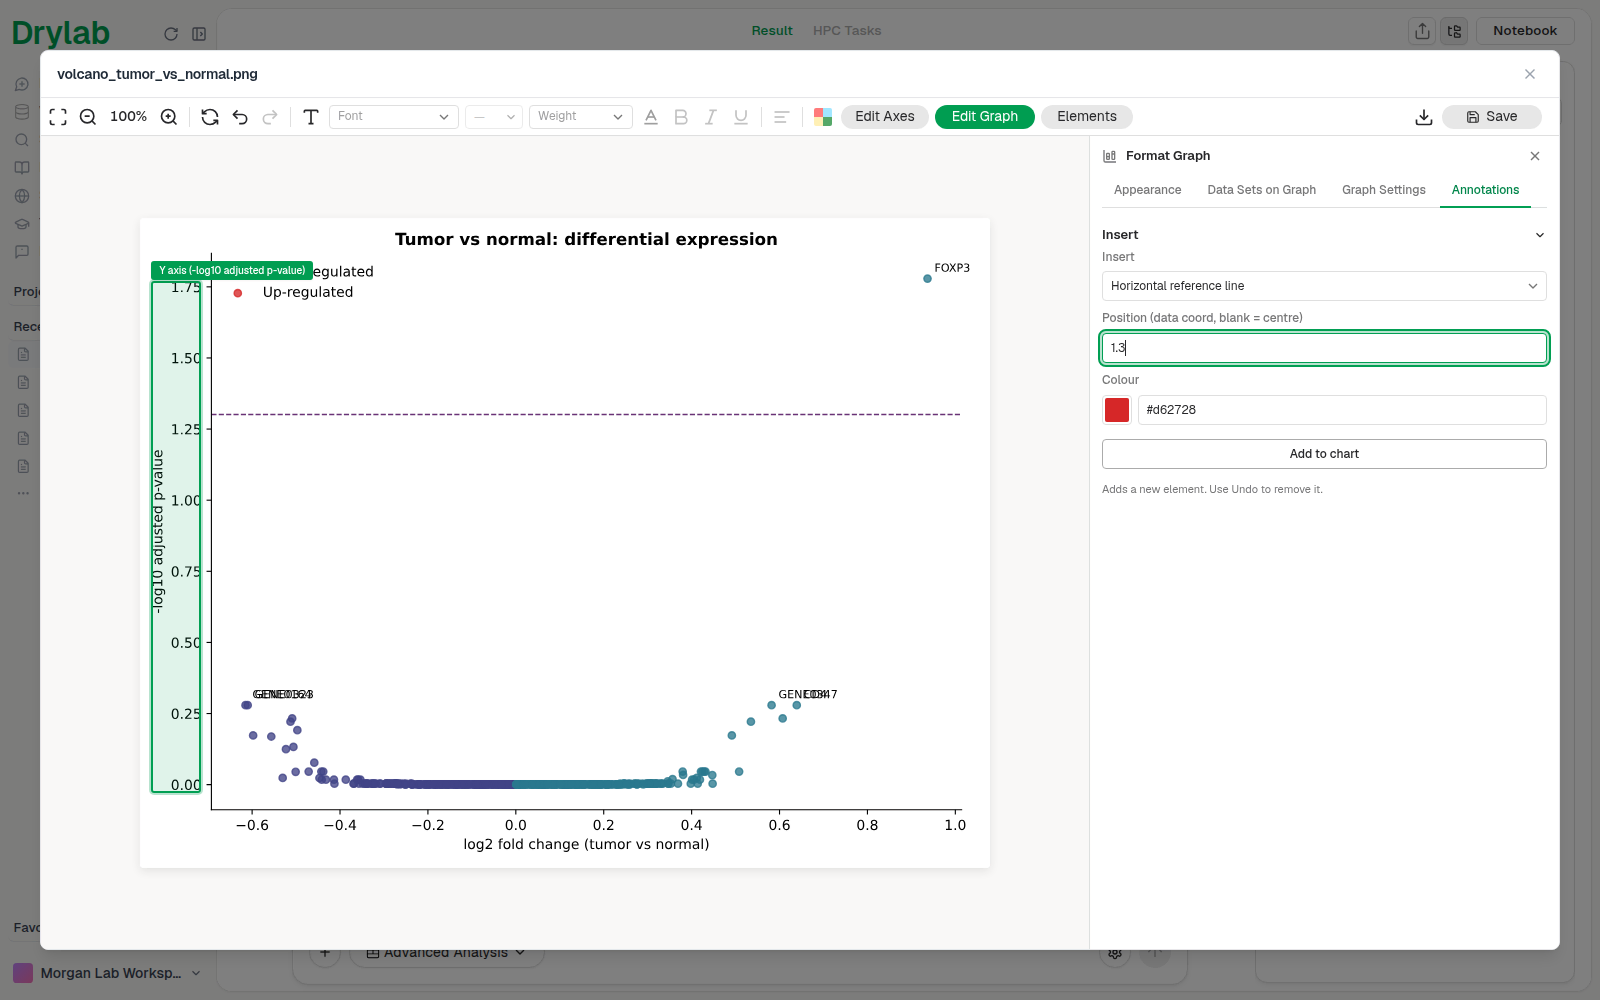
Insert only appears once an axis is selected. On bar charts, the same tab can also put a value on each bar. Use Undo to remove anything you added.
Save your changes
- Click Save in the top right. It's only active when you have unsaved changes.
- Confirm with Save in the "Save figure?" dialog.
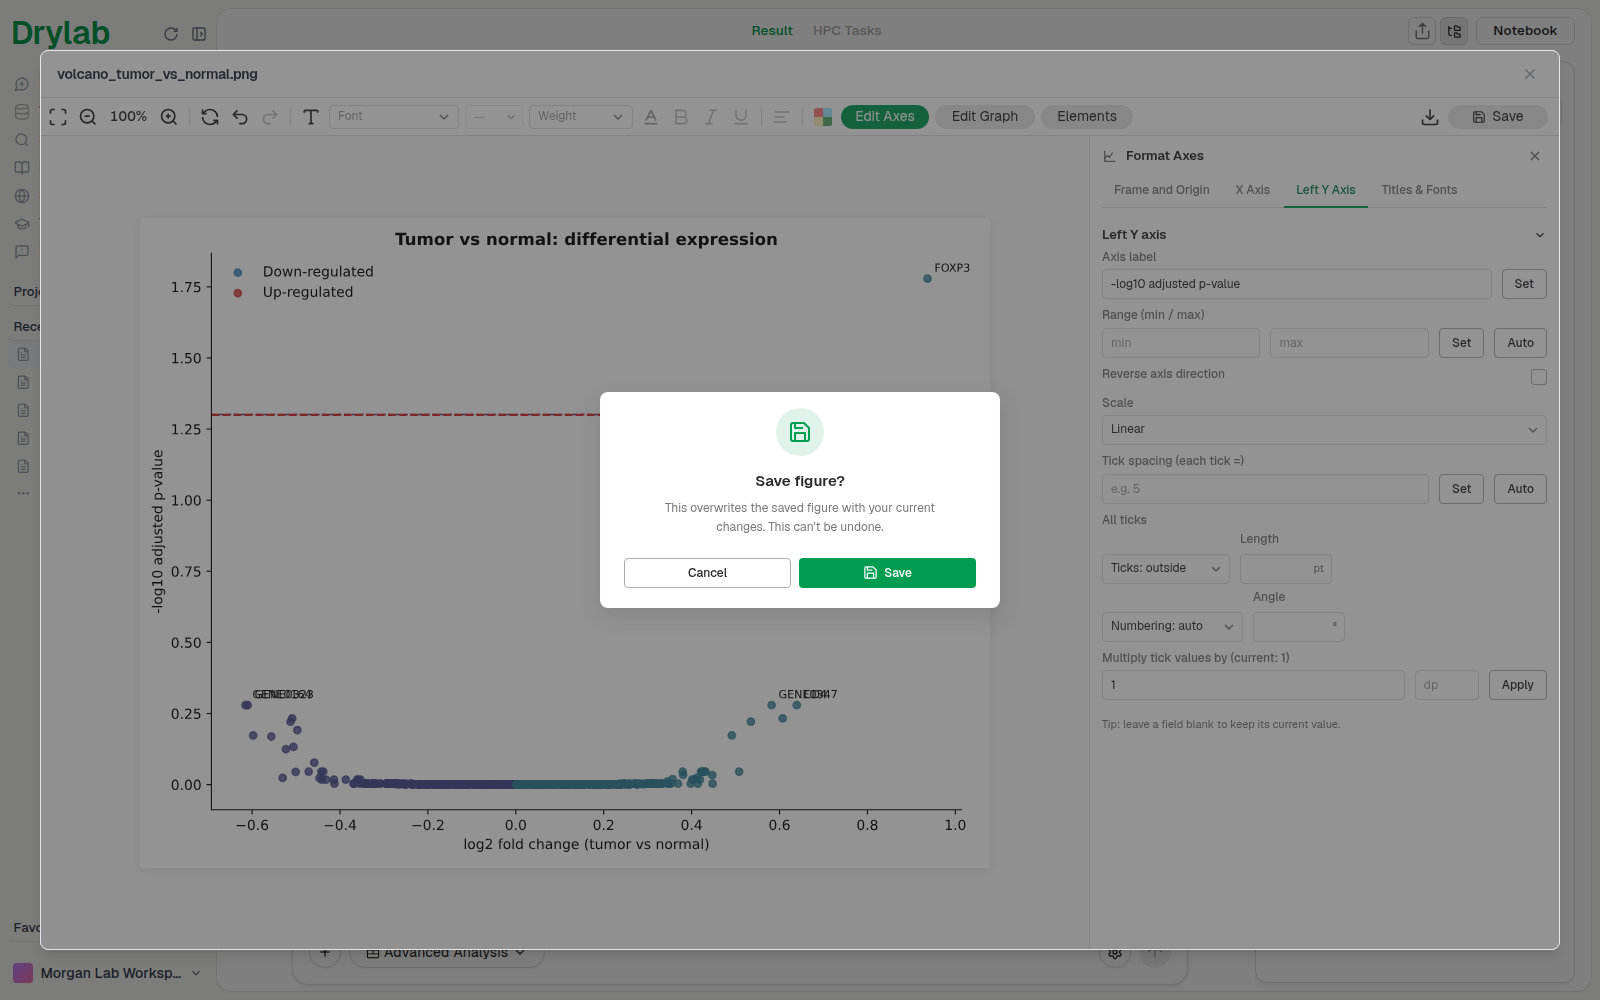
You'll see "Figure saved", and the figure card in the chat updates to the edited version.
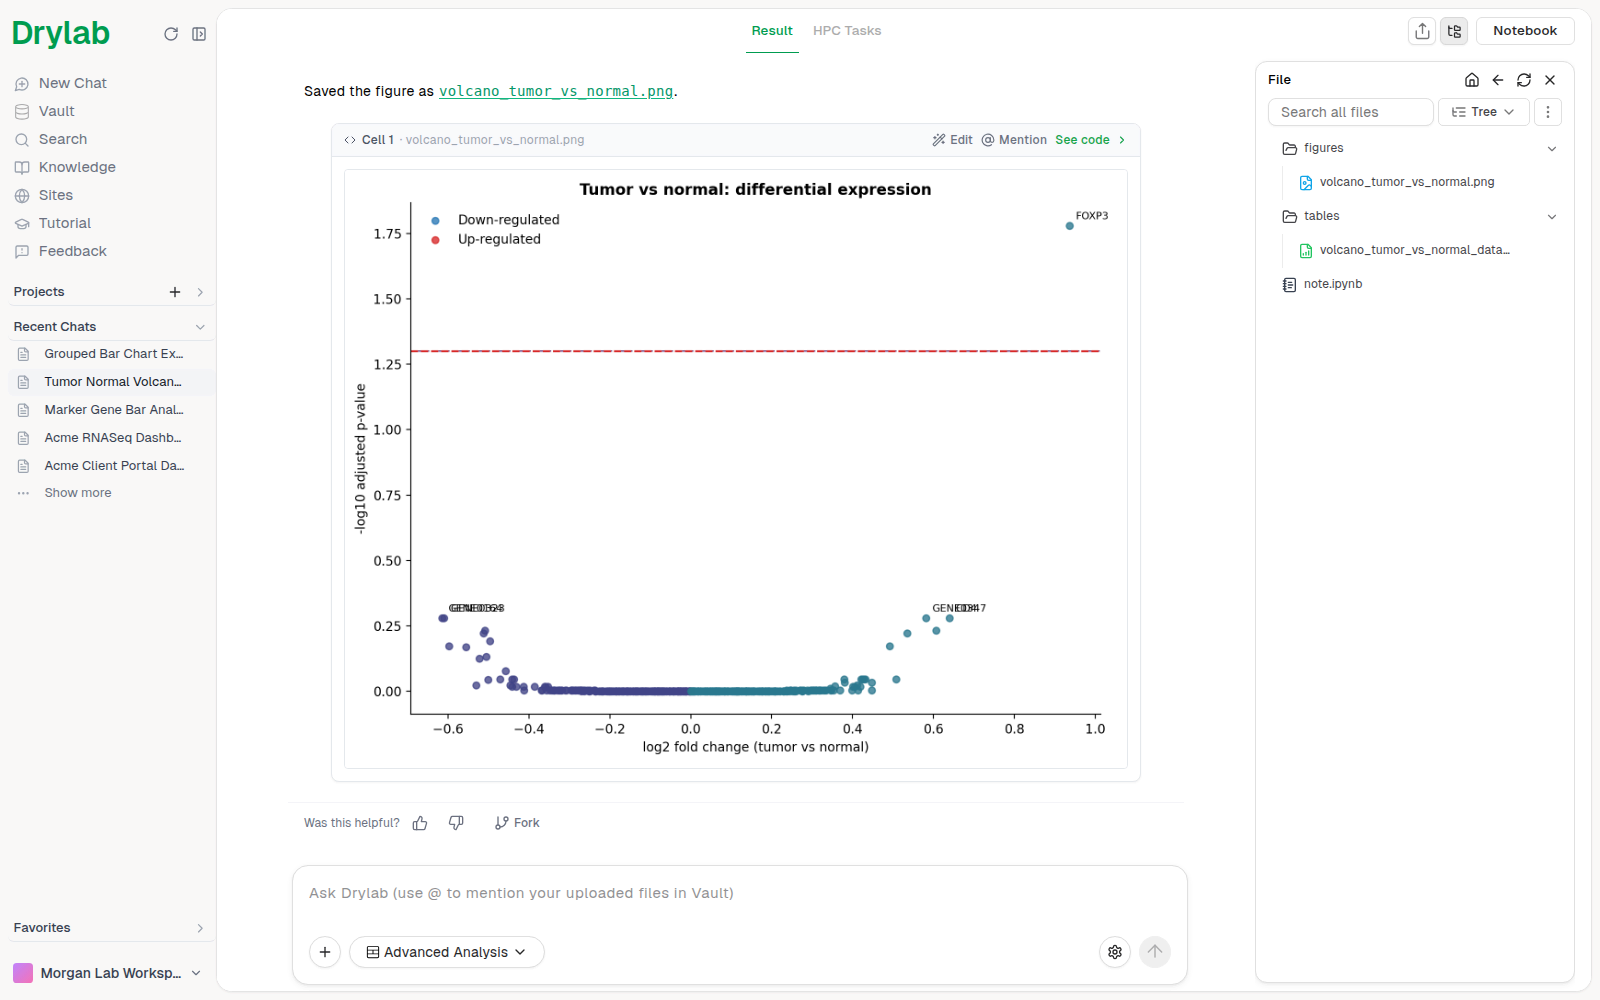
Saving replaces the original figure in the chat and, if the figure was saved as an image file, that file in your project too. This can't be undone. To keep a copy of the original, click Download as soon as the editor opens, before you change anything.
If you close the editor with unsaved changes, Drylab asks what to do: Save now, Don't save, or Cancel to keep editing.
Ask Drylab to change a figure
For changes the editor doesn't cover, click Mention on the figure card. The chat box gets "edit", a mention of the figure, and "to". Finish the sentence and send it. The first time, a hint under Mention says "Click to edit this figure".
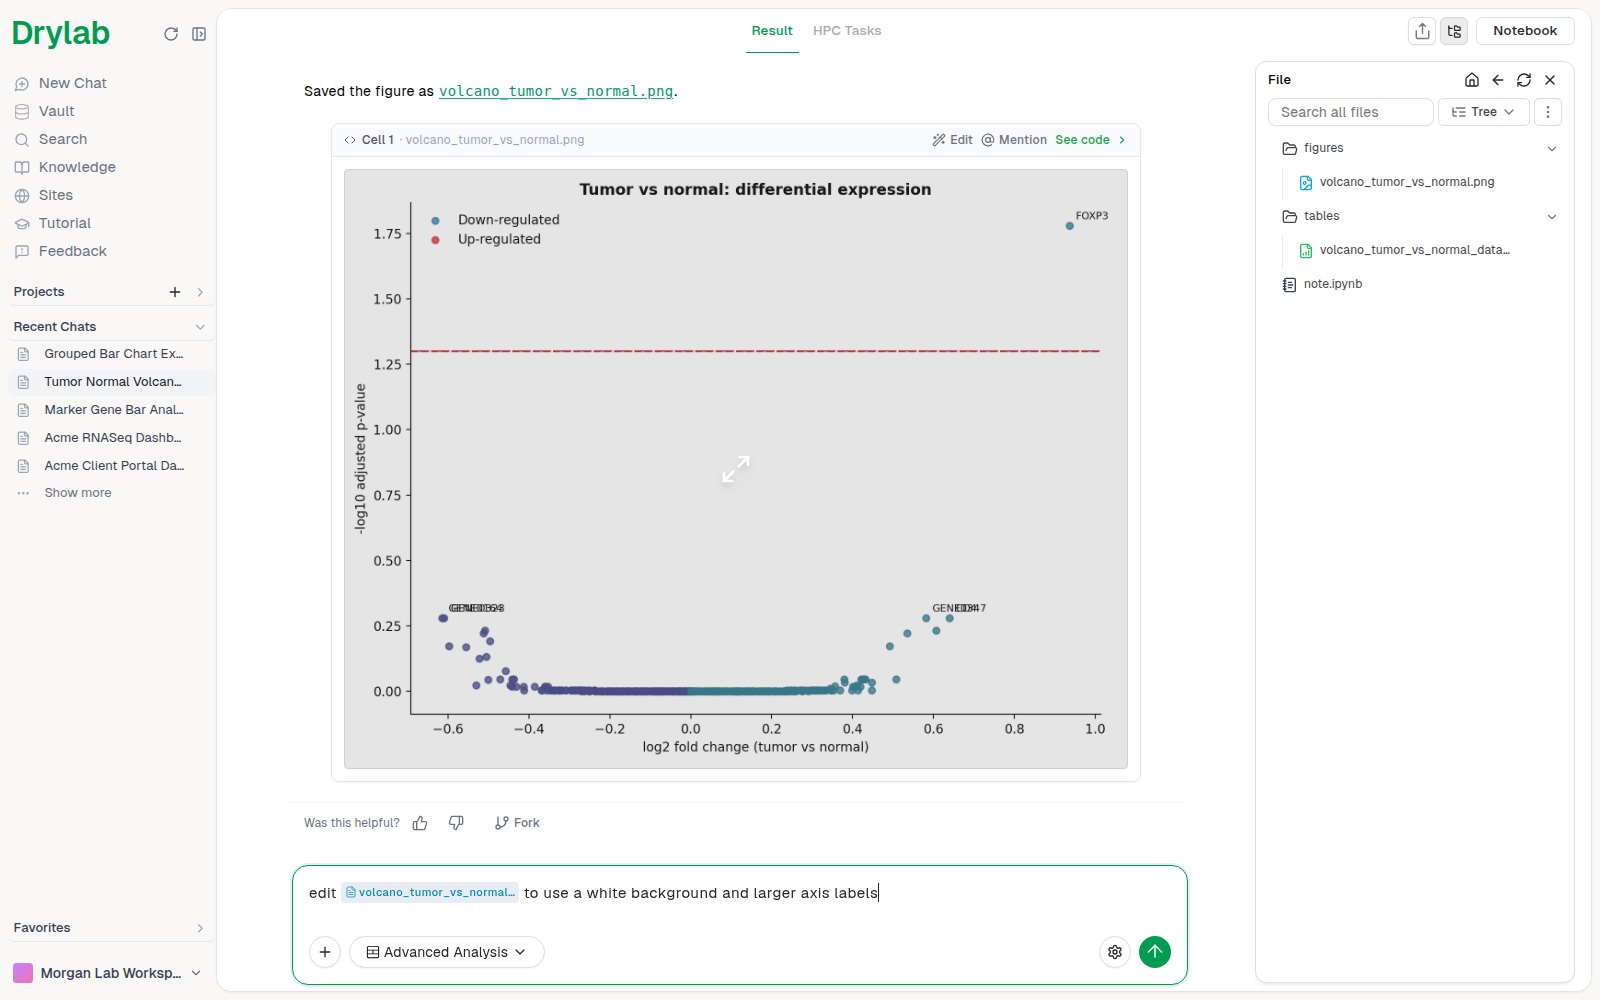
Drylab handles it like any other request, usually by updating the plotting code and running it again. For styling a plot to match a reference image, see Edit Plot Style with a Reference Image.
When Drylab redraws a figure from its code, changes you made in the figure editor are not kept. Ask Drylab for code changes first, then polish the final figure in the editor.
Good to know
- Undo and Redo only cover the current editing session. After you save, Reset goes back to the last saved version, not the original output.
- Download always gives a PNG of the figure as it looks in the editor.
- On pie charts, Edit Axes is called Edit Board.
- Edits you haven't saved are lost if you leave the editor idle for a long time, so save when you're happy with the result.