
Tips & Best Practices
Edit Plot Style with a Reference Image
Give Drylab a reference image and it rewrites your plotting code to match that style.
You provide a reference image of a plot style you want to replicate, and the AI analyzes it and rewrites your plotting code to match that style.
Reference image → AI analyzes style → Rewrites your plot code → Matched output
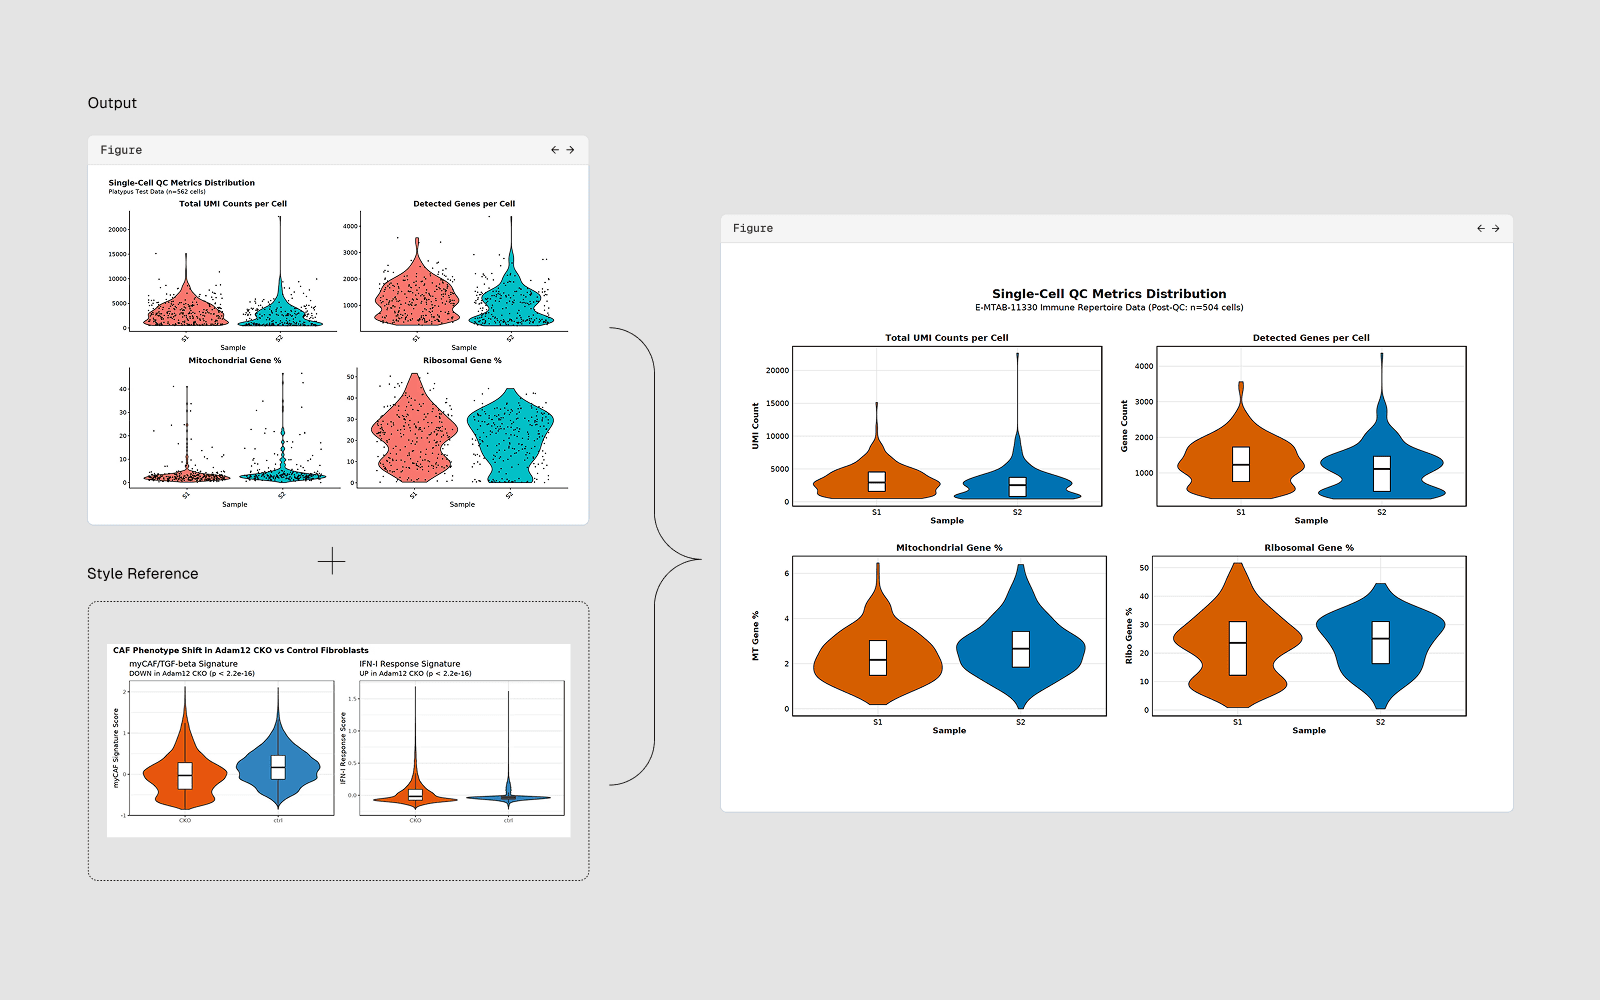
Style elements the AI can extract and apply
| Element | Example |
|---|---|
| Color palette | Exact hex colors for categories or colormaps |
| Font | Family (serif, sans-serif), size, weight |
| Axes style | Spines on/off, tick direction, tick length |
| Background | White, light grey, dark theme |
| Grid | On/off, major/minor, color, linestyle |
| Legend | Position, frame, font size, number of columns |
| Markers | Shape, size, edge color, transparency |
| Line style | Width, dash pattern, color |
| Figure size | Width x height in inches or mm |
| Colorbar | Position, label, tick spacing |
How to restyle a plot
Step 1: Upload your reference image
- Click + in the chatbox and choose Upload file, or paste an image from the clipboard (Ctrl+V / Cmd+V)
- Select your reference image (
.png,.jpg,.pdf) - Or drag it directly into the chat
For example: [Paste image] Make my scatter plot look like this. Match the background color, marker style, grid lines, and colorbar style exactly.
Step 2: Describe what you want
Here is a reference plot from a Nature paper. Restyle my current plot @figure1.png to match this style:
- Same color palette
- Same font size and family
- Same axis style (no top/right spines)
- Same legend position
Tips for better style matching
- Use high-resolution reference images. Higher resolution images allow the AI to detect visual details more accurately.
- Crop the reference figure. Crop the image to the plot area only. Removing surrounding text helps the AI focus on the visual style.
- Mention your current plot file. Use
@filenameto reference the figure you want to modify. - Iterate. If the result is close but not perfect, refine the prompt.
- Fine-tune by hand. For small changes such as a title, a colour or an axis range, click Edit on the figure card, if it has one, instead. See Edit Figures.