
Tips from the Drylab Team
Practical tips from the Drylab team for briefing the AI and getting accurate results faster.
Bioinformatics analysis can quickly become complex, with different datasets requiring different tools at each stage of the workflow.
Whether you're starting with raw data or already have a processed object, choosing the right analysis path makes all the difference.
A few tips from the Drylab team:
1. State the scientific goal
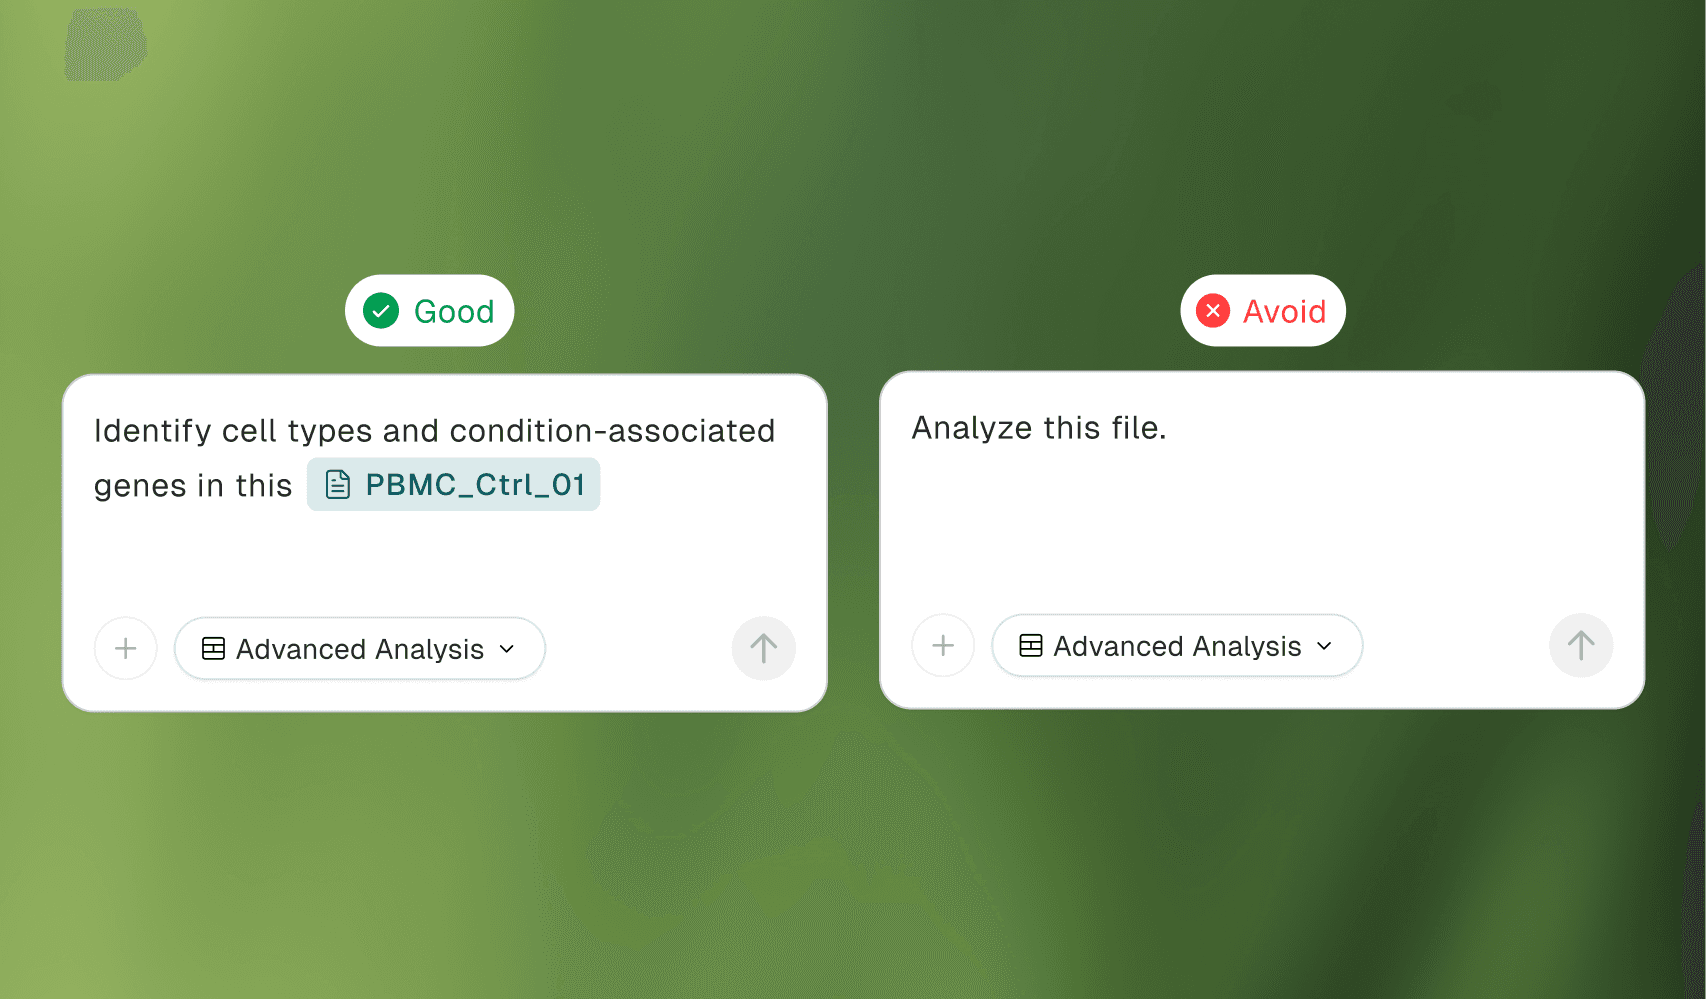
2. Provide the inputs and experimental design
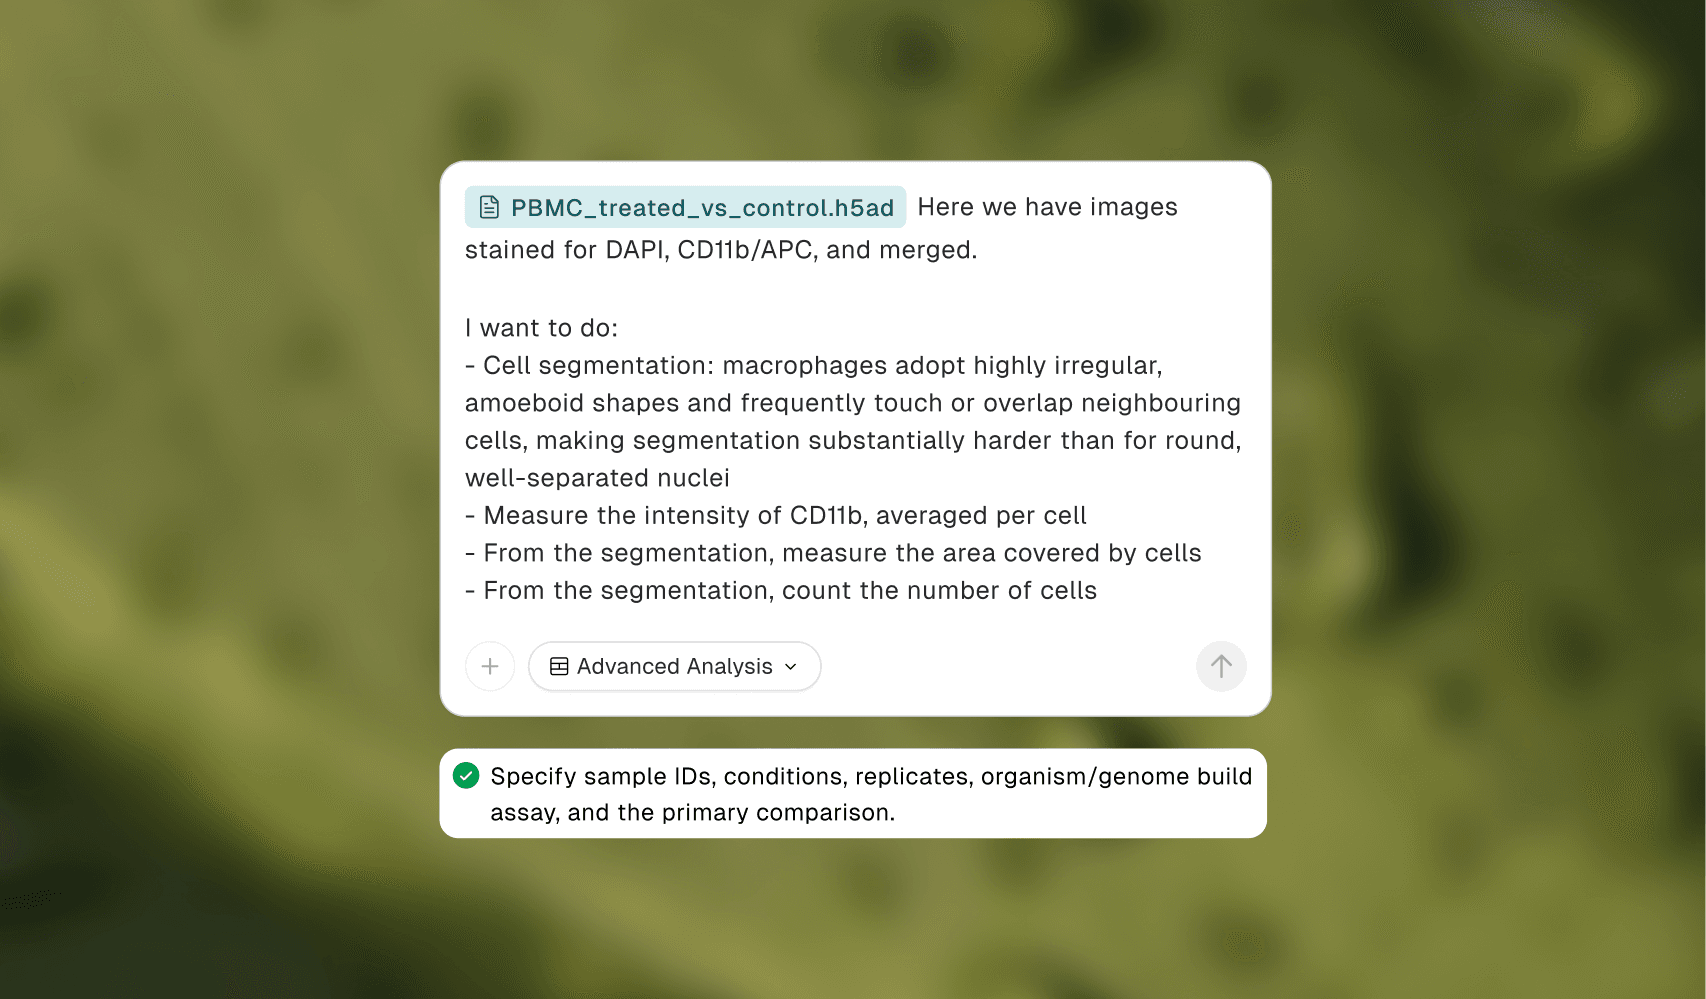
- Upload the data (click + in the chatbox, drag files in, or paste images) or point to files already in your Vault with
@. - Specify sample IDs, conditions, replicates, organism/genome build, assay, and the primary comparison.
3. Use "@" to call a tool
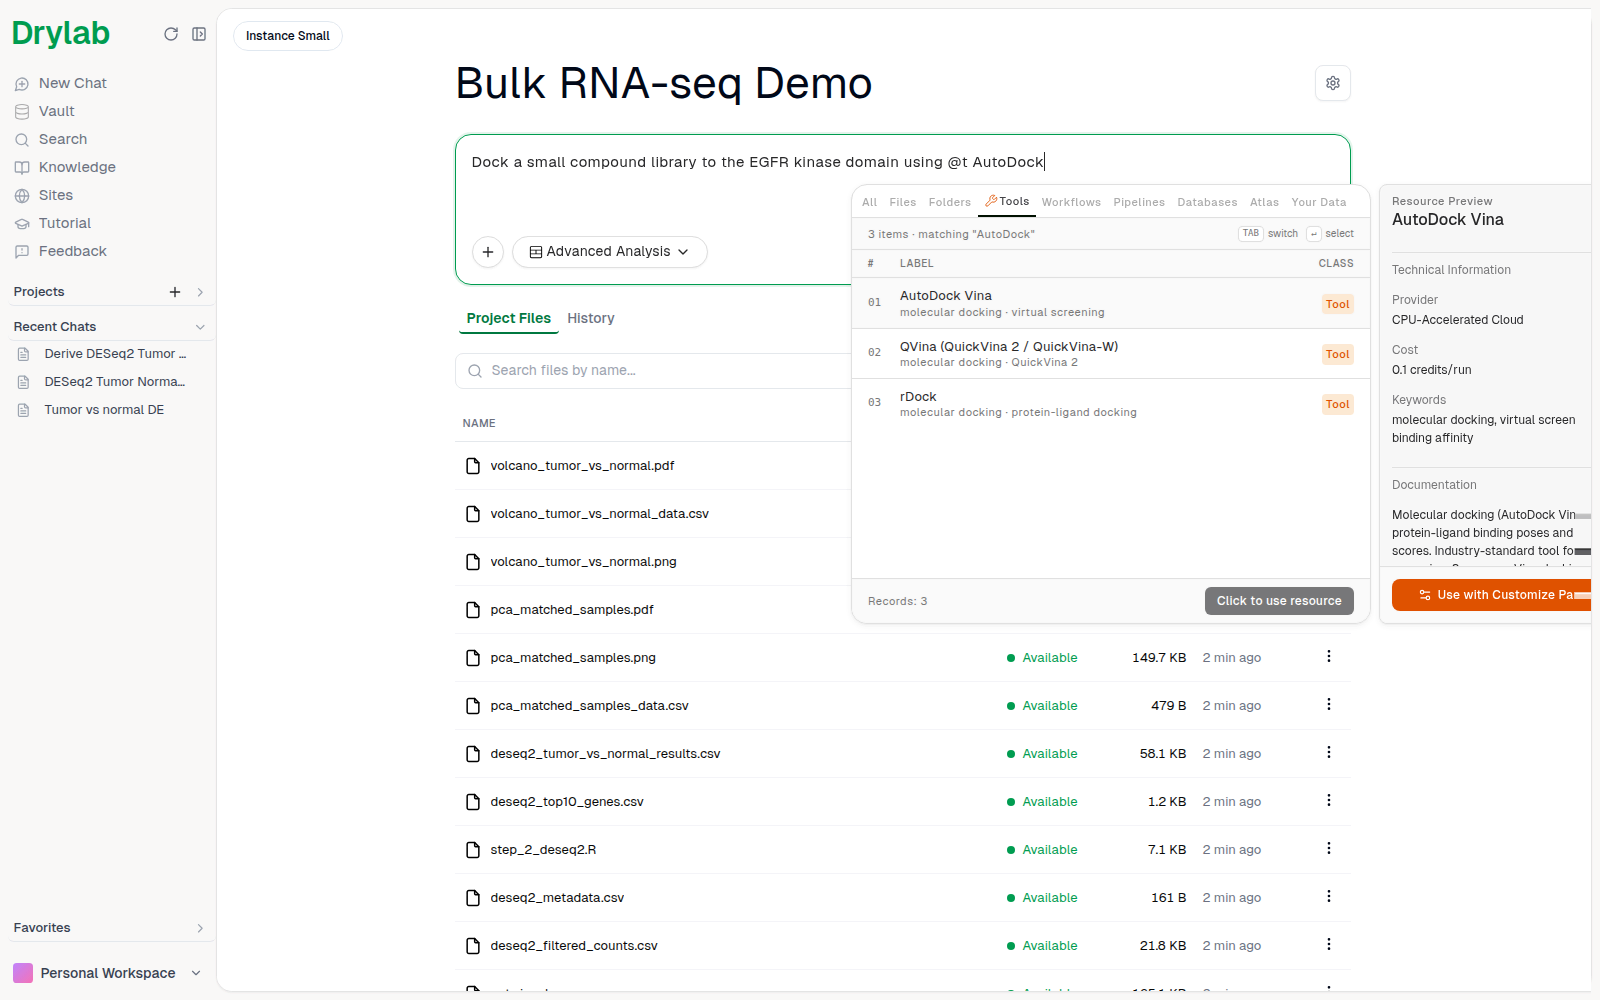
Type @ in the chatbox to open the picker with tabs for All, Files, Folders, Tools, Workflows, Pipelines, Databases, Atlas and Your Data. Keep typing to filter (for example @t autodock for tools) and hover an item to see its Resource Preview (tools also show their cost per run). See Mention Files and Resources.
This helps Drylab lock onto the right context from the start, giving you faster, more accurate output.
4. Ask for an initial inspection
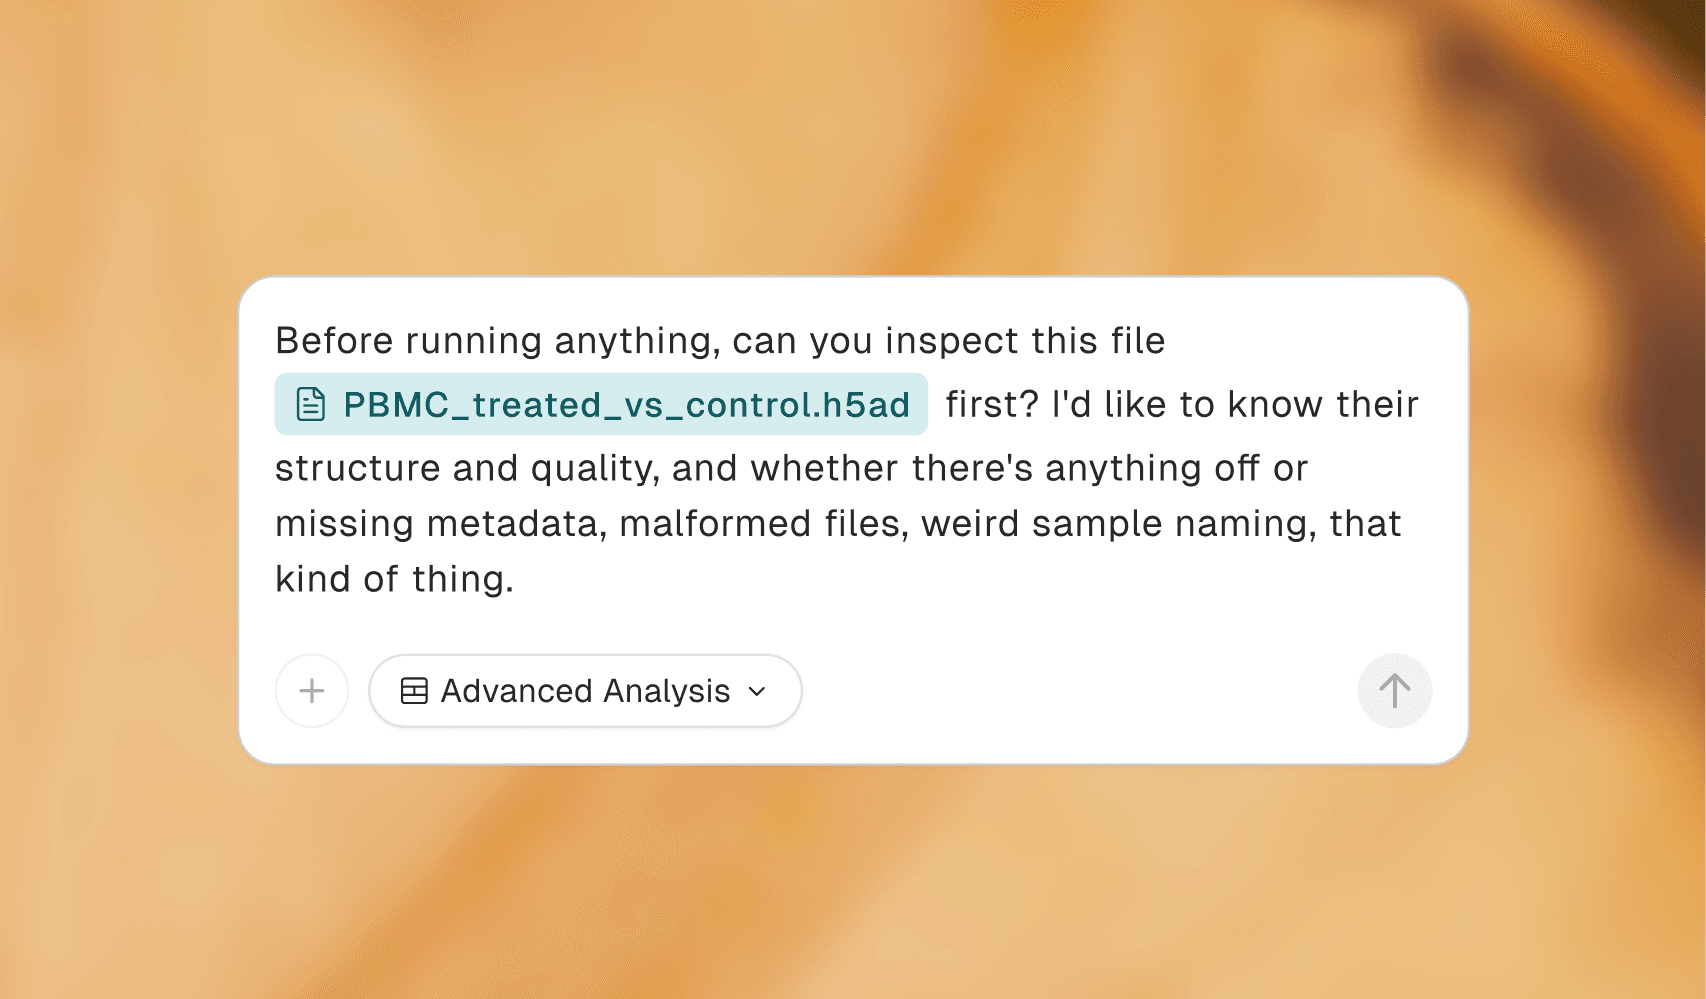
- Example: "Inspect the files, report their structure and quality, and propose an analysis plan."
- This catches missing metadata, malformed files, and design problems before expensive computation.
5. Make judgment calls explicit
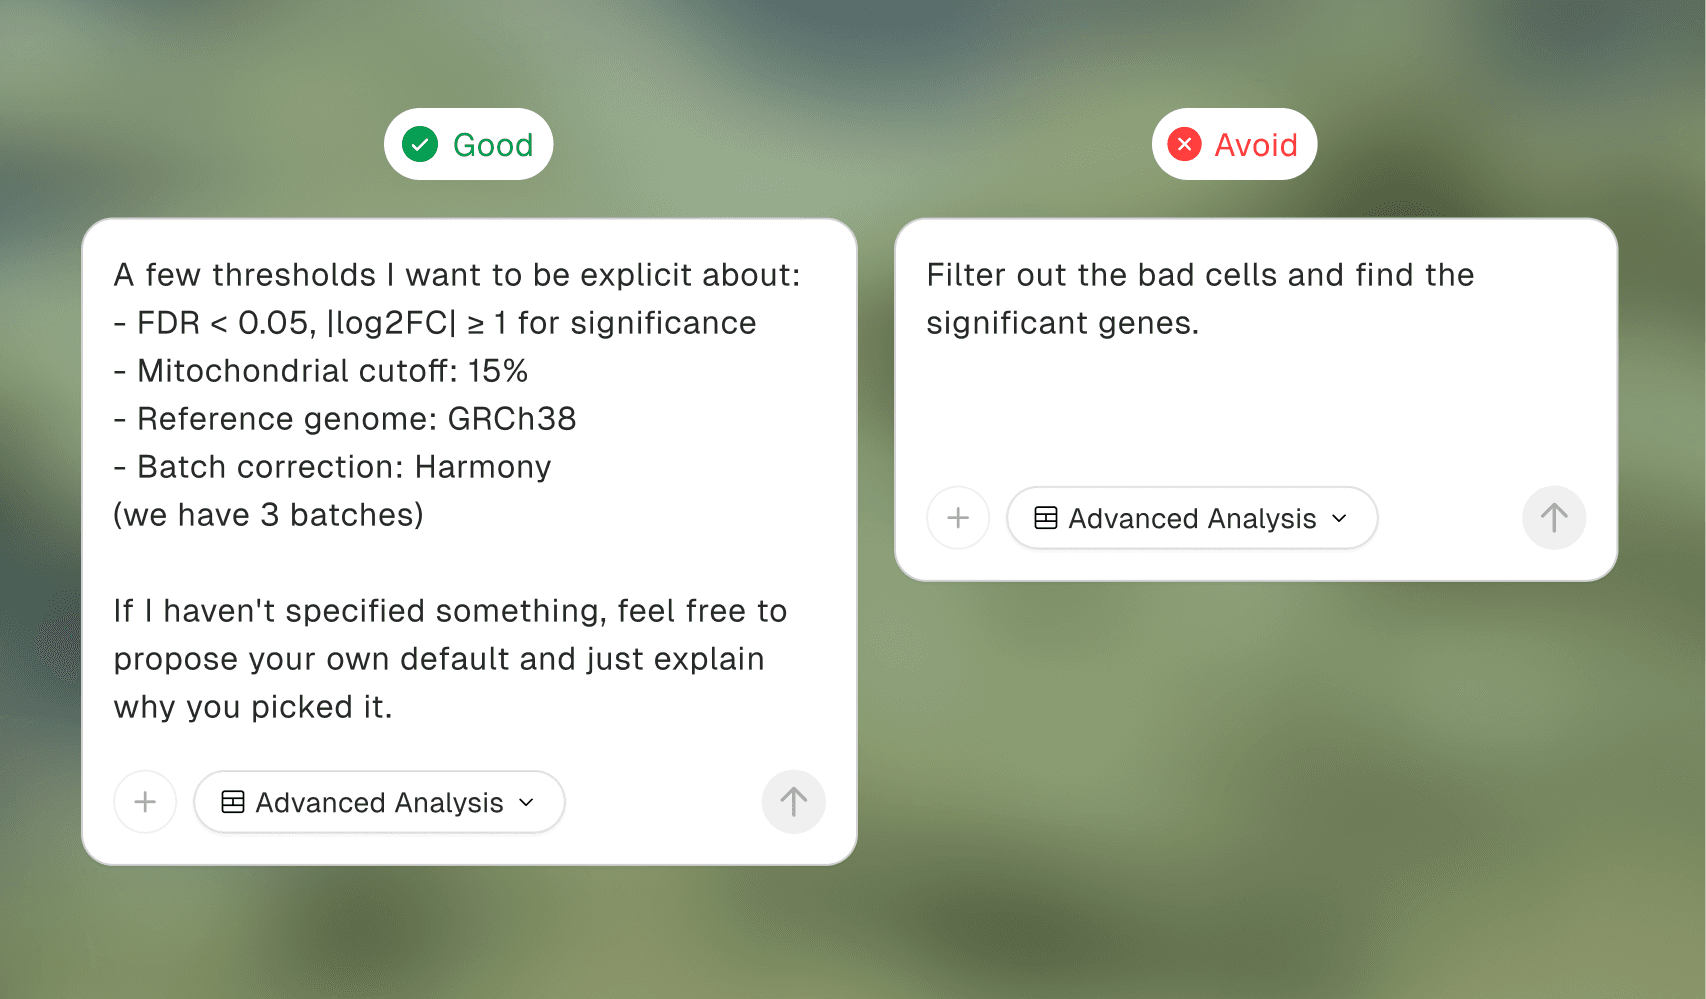
- State thresholds when they matter: e.g., FDR < 0.05, |log2FC| ≥ 1, mitochondrial cutoff, reference genome, or batch-correction strategy.
- If you do not have a preference, ask Drylab to propose defaults and explain them.
6. Approve a plan for multi-stage work
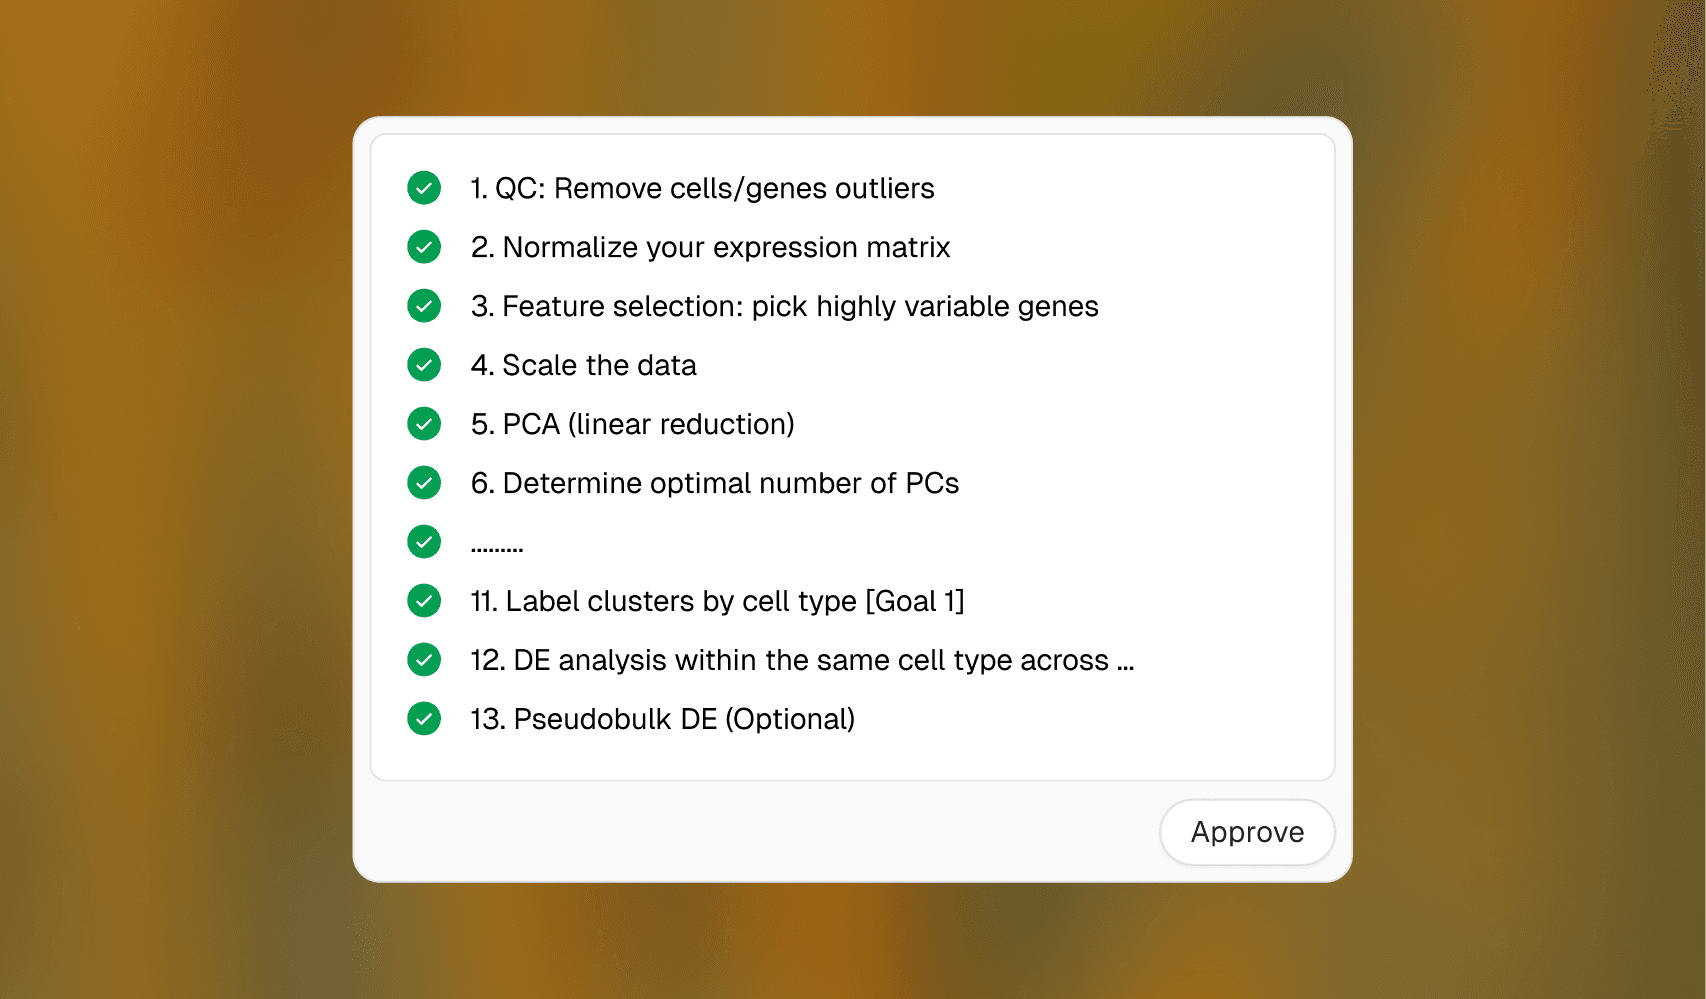
A typical sequence:
- Data validation/QC
- Preprocessing and normalization
- Core analysis (e.g., clustering, DE, variants)
- Interpretation/enrichment
- Figures, tables, and saved reproducible outputs
Edit Plot Style with a Reference Image
Give Drylab a reference image and it rewrites your plotting code to match that style.
The scRNA-seq Workflow in Drylab
A complete walkthrough of GSE162631 (glioblastoma scRNA-seq) — from raw 10x counts to annotated clusters — with the exact prompts used at each step.