
The scRNA-seq Workflow in Drylab
A complete walkthrough of GSE162631 (glioblastoma scRNA-seq) — from raw 10x counts to annotated clusters — with the exact prompts used at each step.
A complete walkthrough of GSE162631 (glioblastoma scRNA-seq) — from raw 10x counts to annotated clusters — with the exact prompts used at each step.
Stage 1 — Set up
Find the right workflow and brief it properly before anything runs.
1. Find the workflow: search @scrna
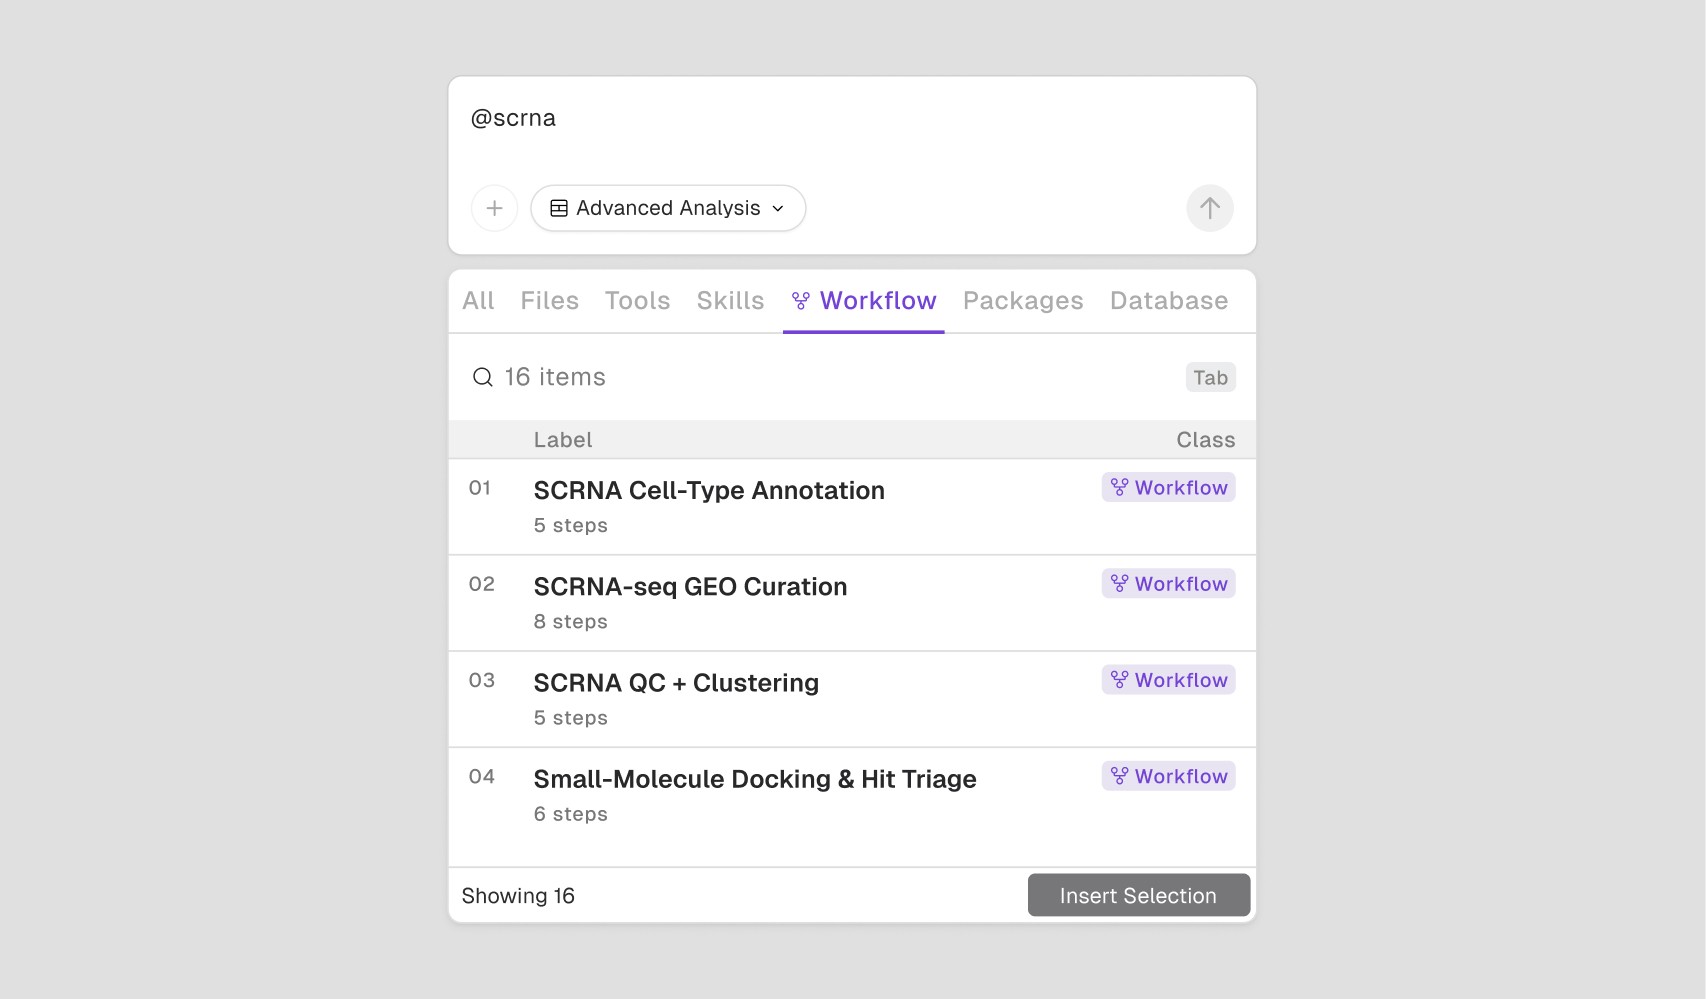
Type @scrna in a new chat. Drylab filters to the single-cell workflows: scRNA Cell-Type Annotation, scRNA QC + Clustering and Spatial Domain Detection & Annotation. This walkthrough uses scRNA QC + Clustering first, then chains into scRNA Cell-Type Annotation later.
2. Preview it: read the numbered steps and their tags
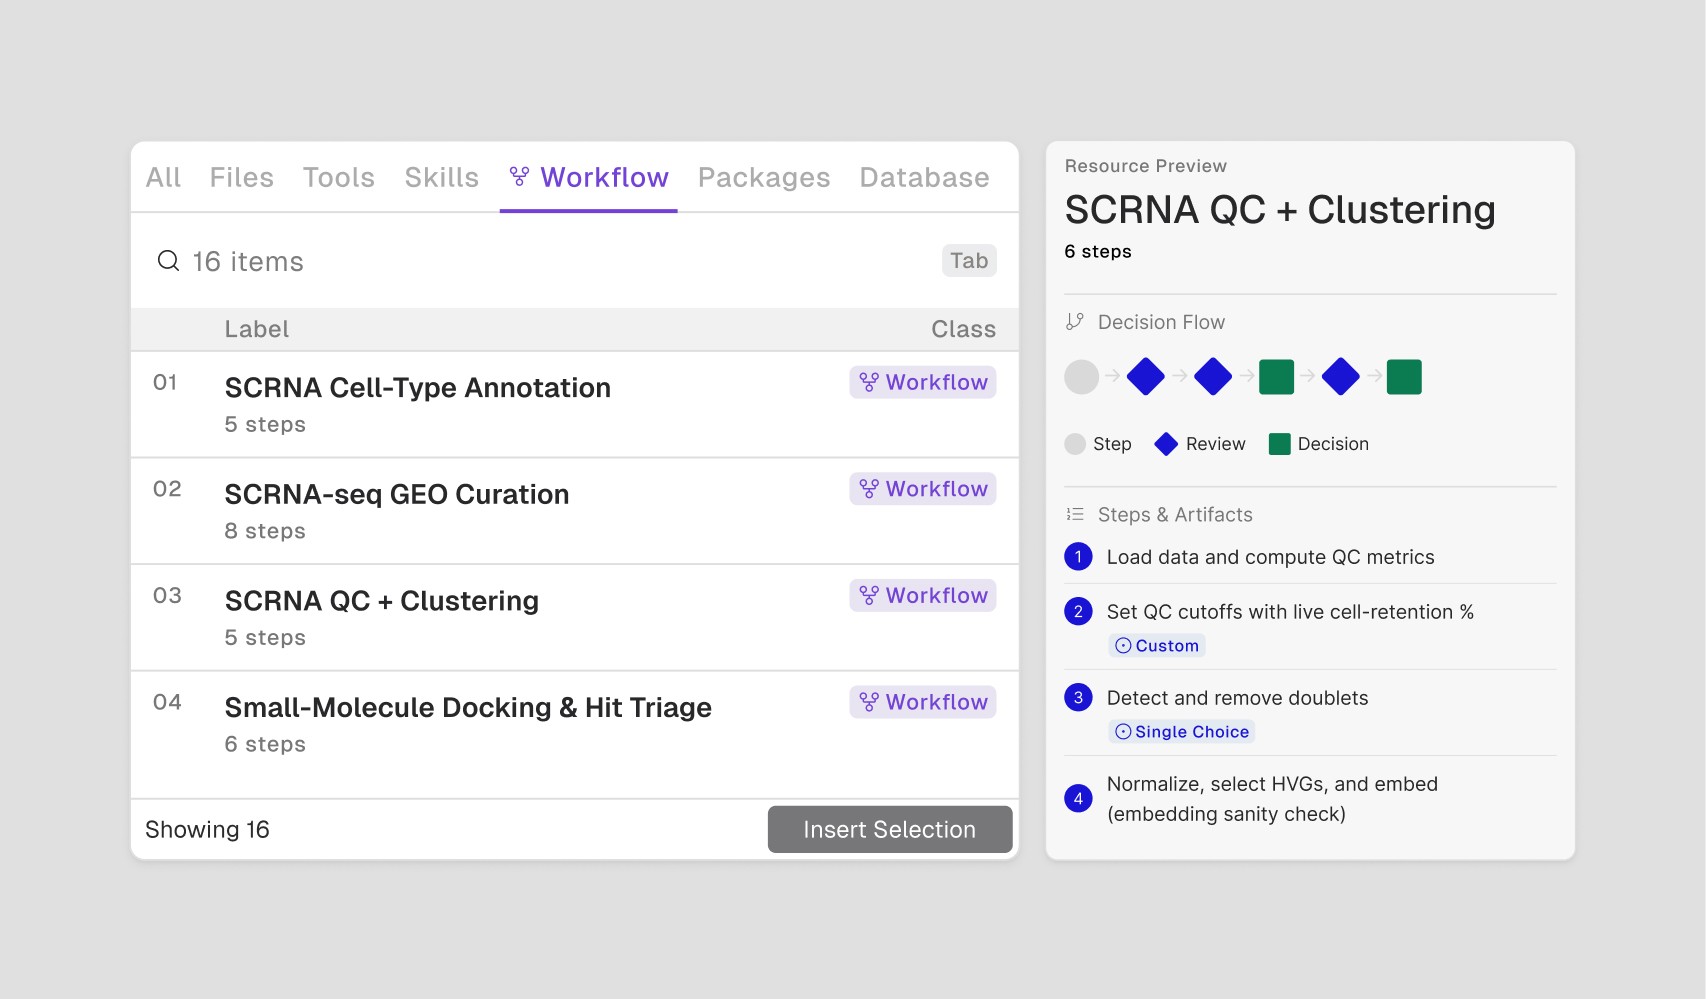
Before selecting it, scroll the resource preview. scRNA QC + Clustering is six steps: (1) Load data and compute QC metrics, (2) Set QC cutoffs — Custom, (3) Detect and remove doublets — Single Choice, (4) Normalize, select HVGs, and embed — Gating Tree, (5) Choose clustering resolution — Image Choice, (6) Export QC'd + clustered object. Three of the six will pause for your input; the tags tell you which ones and how.
3. Read the Documentation and Skills Used
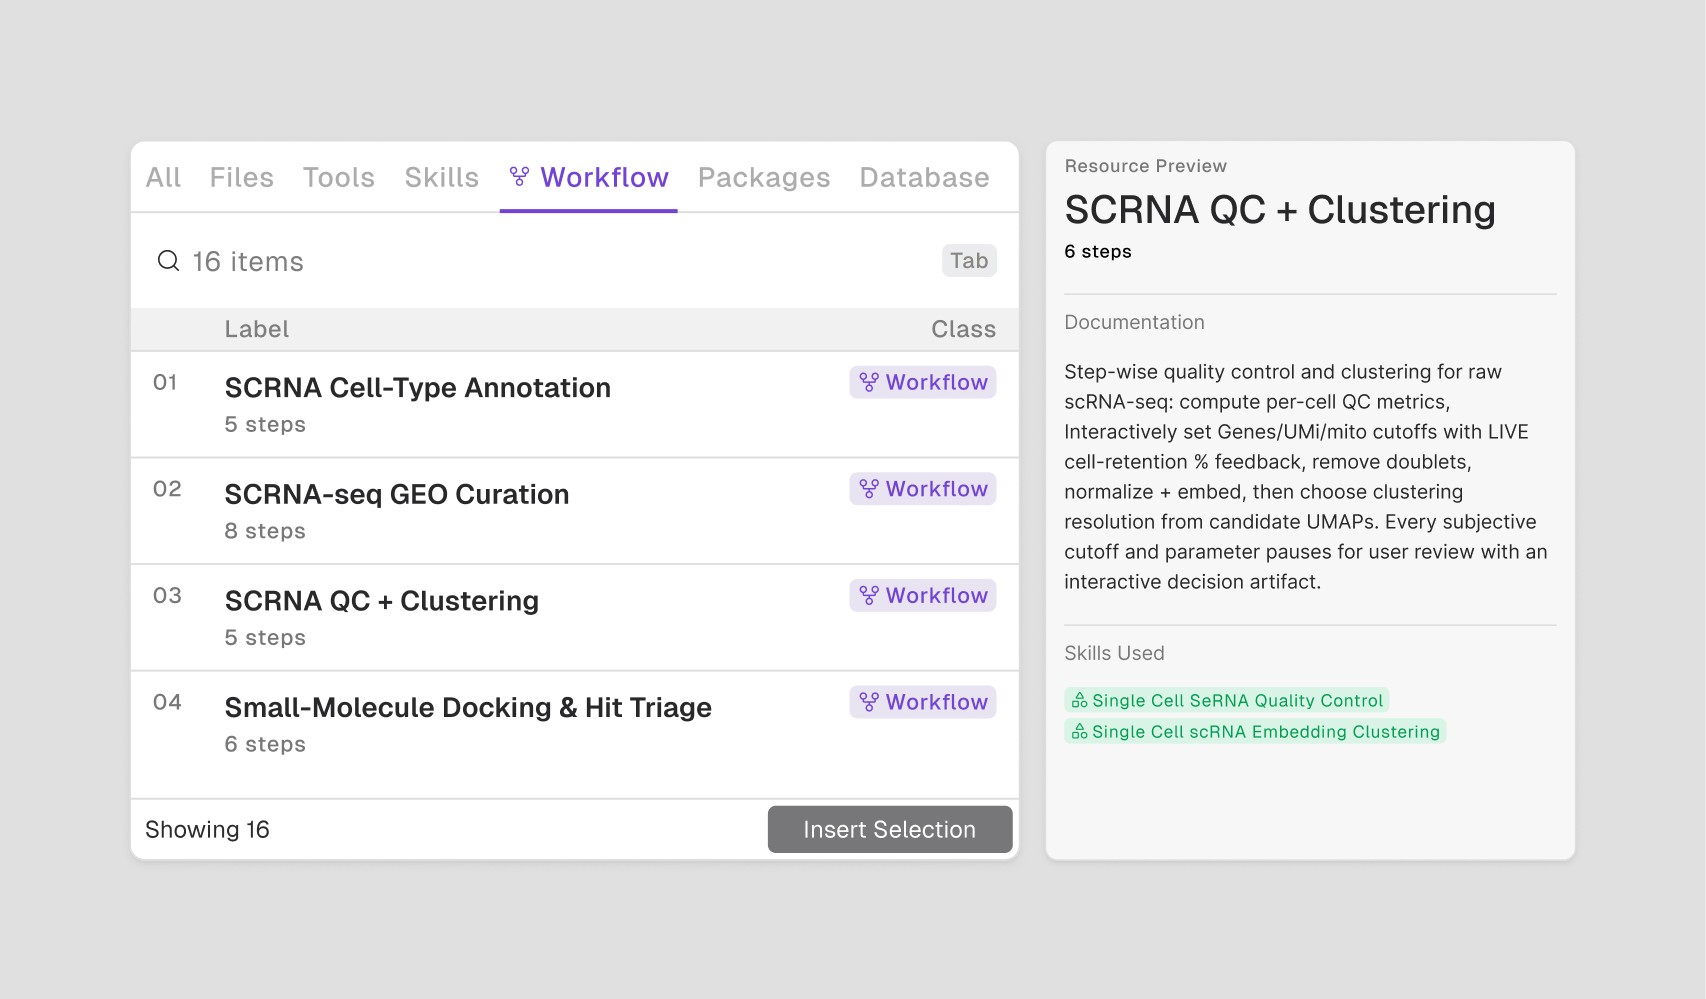
The Documentation confirms this is the right workflow: "Step-wise quality control and clustering for raw scRNA-seq: compute per-cell QC metrics, interactively set nGenes/UMI/mito cutoffs with LIVE cell-retention % feedback, remove doublets, normalize + embed, then choose clustering resolution from candidate UMAPs." Skills Used lists Single Cell scRNA Quality Control and Single Cell scRNA Embedding Clustering.
4. Set your review mode
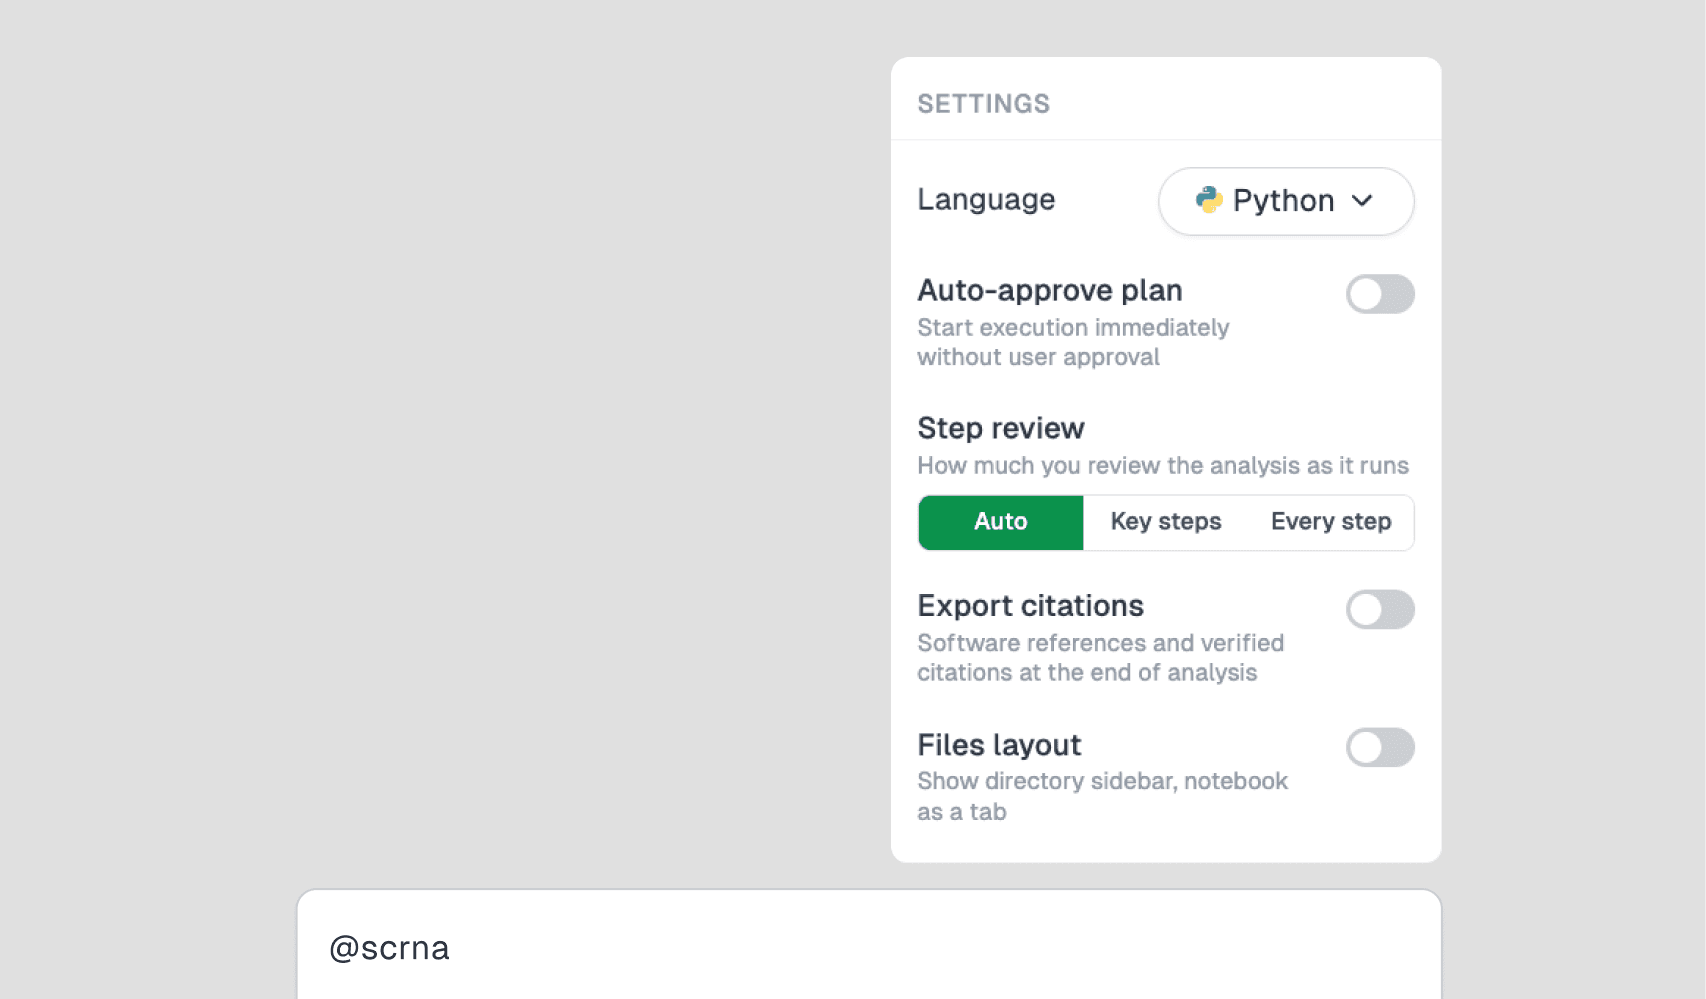
Open Analysis settings (the gear at the right of the chatbox, next to the send button). Step review has three options: Auto (run the whole plan after you approve it), Key steps (pause only on subjective, high-risk steps such as cell-type annotation) and Every step. If this is your first time running QC + Clustering on this dataset, choose Every step so you see each checkpoint as it happens. You can relax to Key steps or Auto on a rerun once you've validated the thresholds. See Analysis settings.
Stage 2 — QC + clustering
Kick off, then work through each checkpoint as Drylab surfaces it.
1. Kick off with a fully-specified prompt
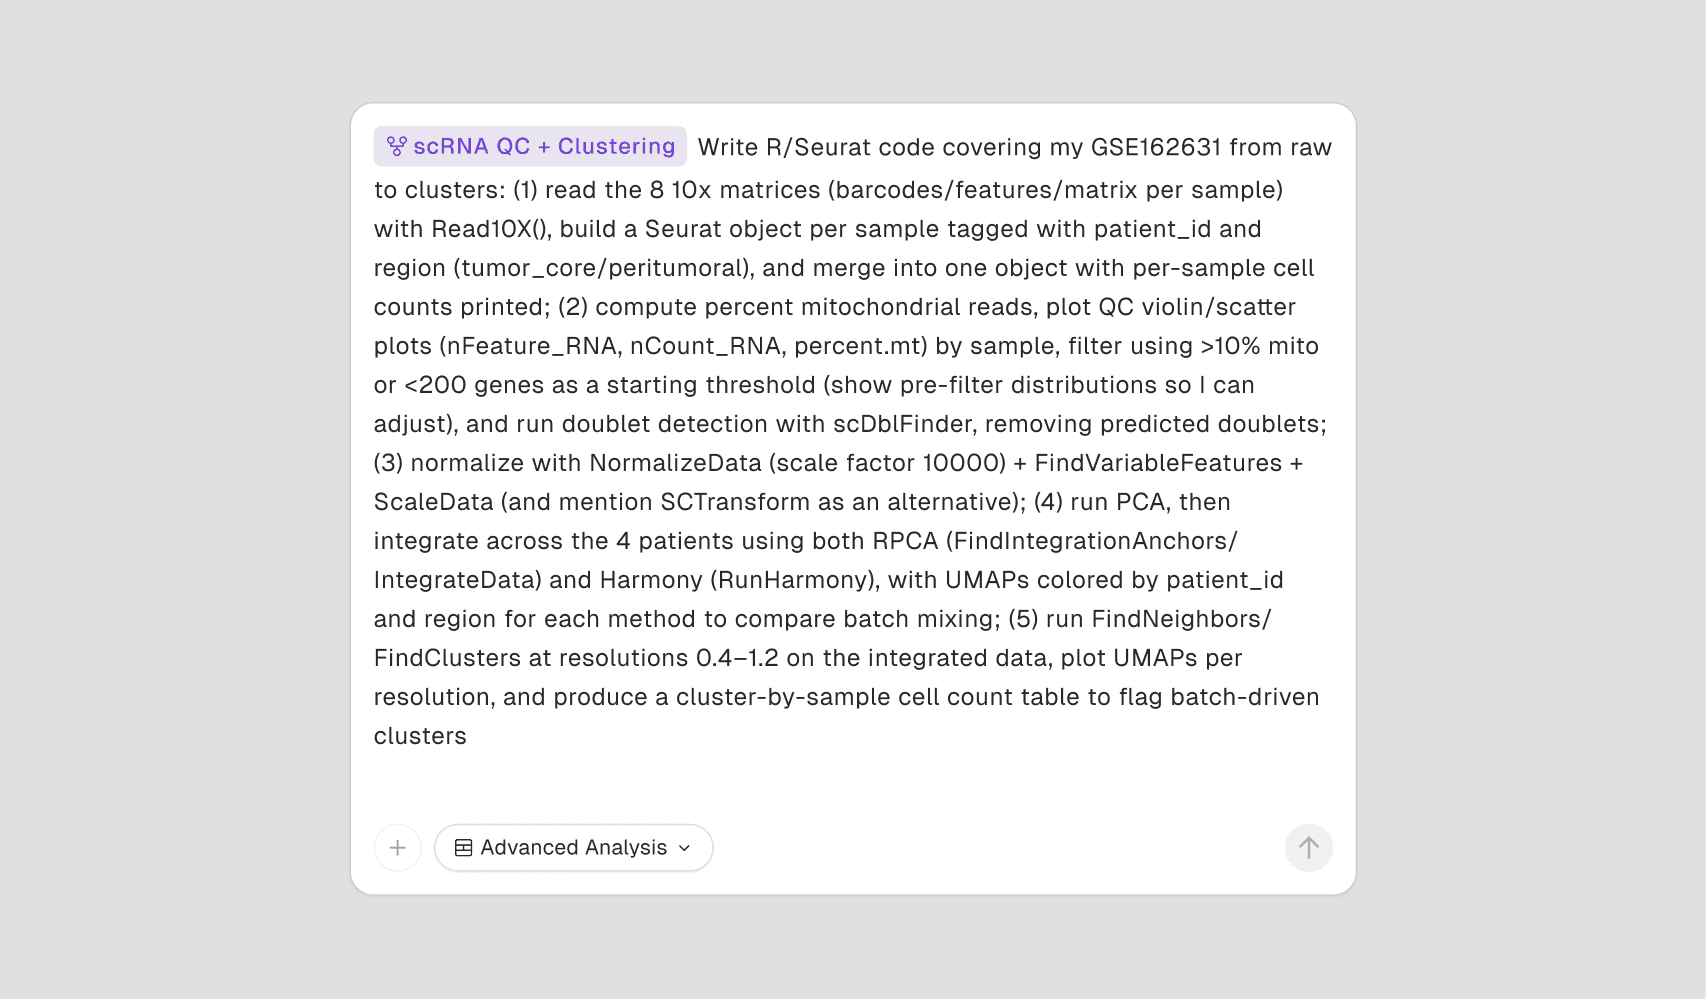
This is the actual prompt used to start this walkthrough — @scRNA QC + Clustering, followed by every detail Drylab needed:
Notice it names every tool (Read10X, scDblFinder, NormalizeData, RPCA, Harmony), every threshold (>10% mito, <200 genes, resolutions 0.4–1.2), and every metadata field (patient_id, region) — nothing is left for Drylab to guess.
2. Review the generated plan
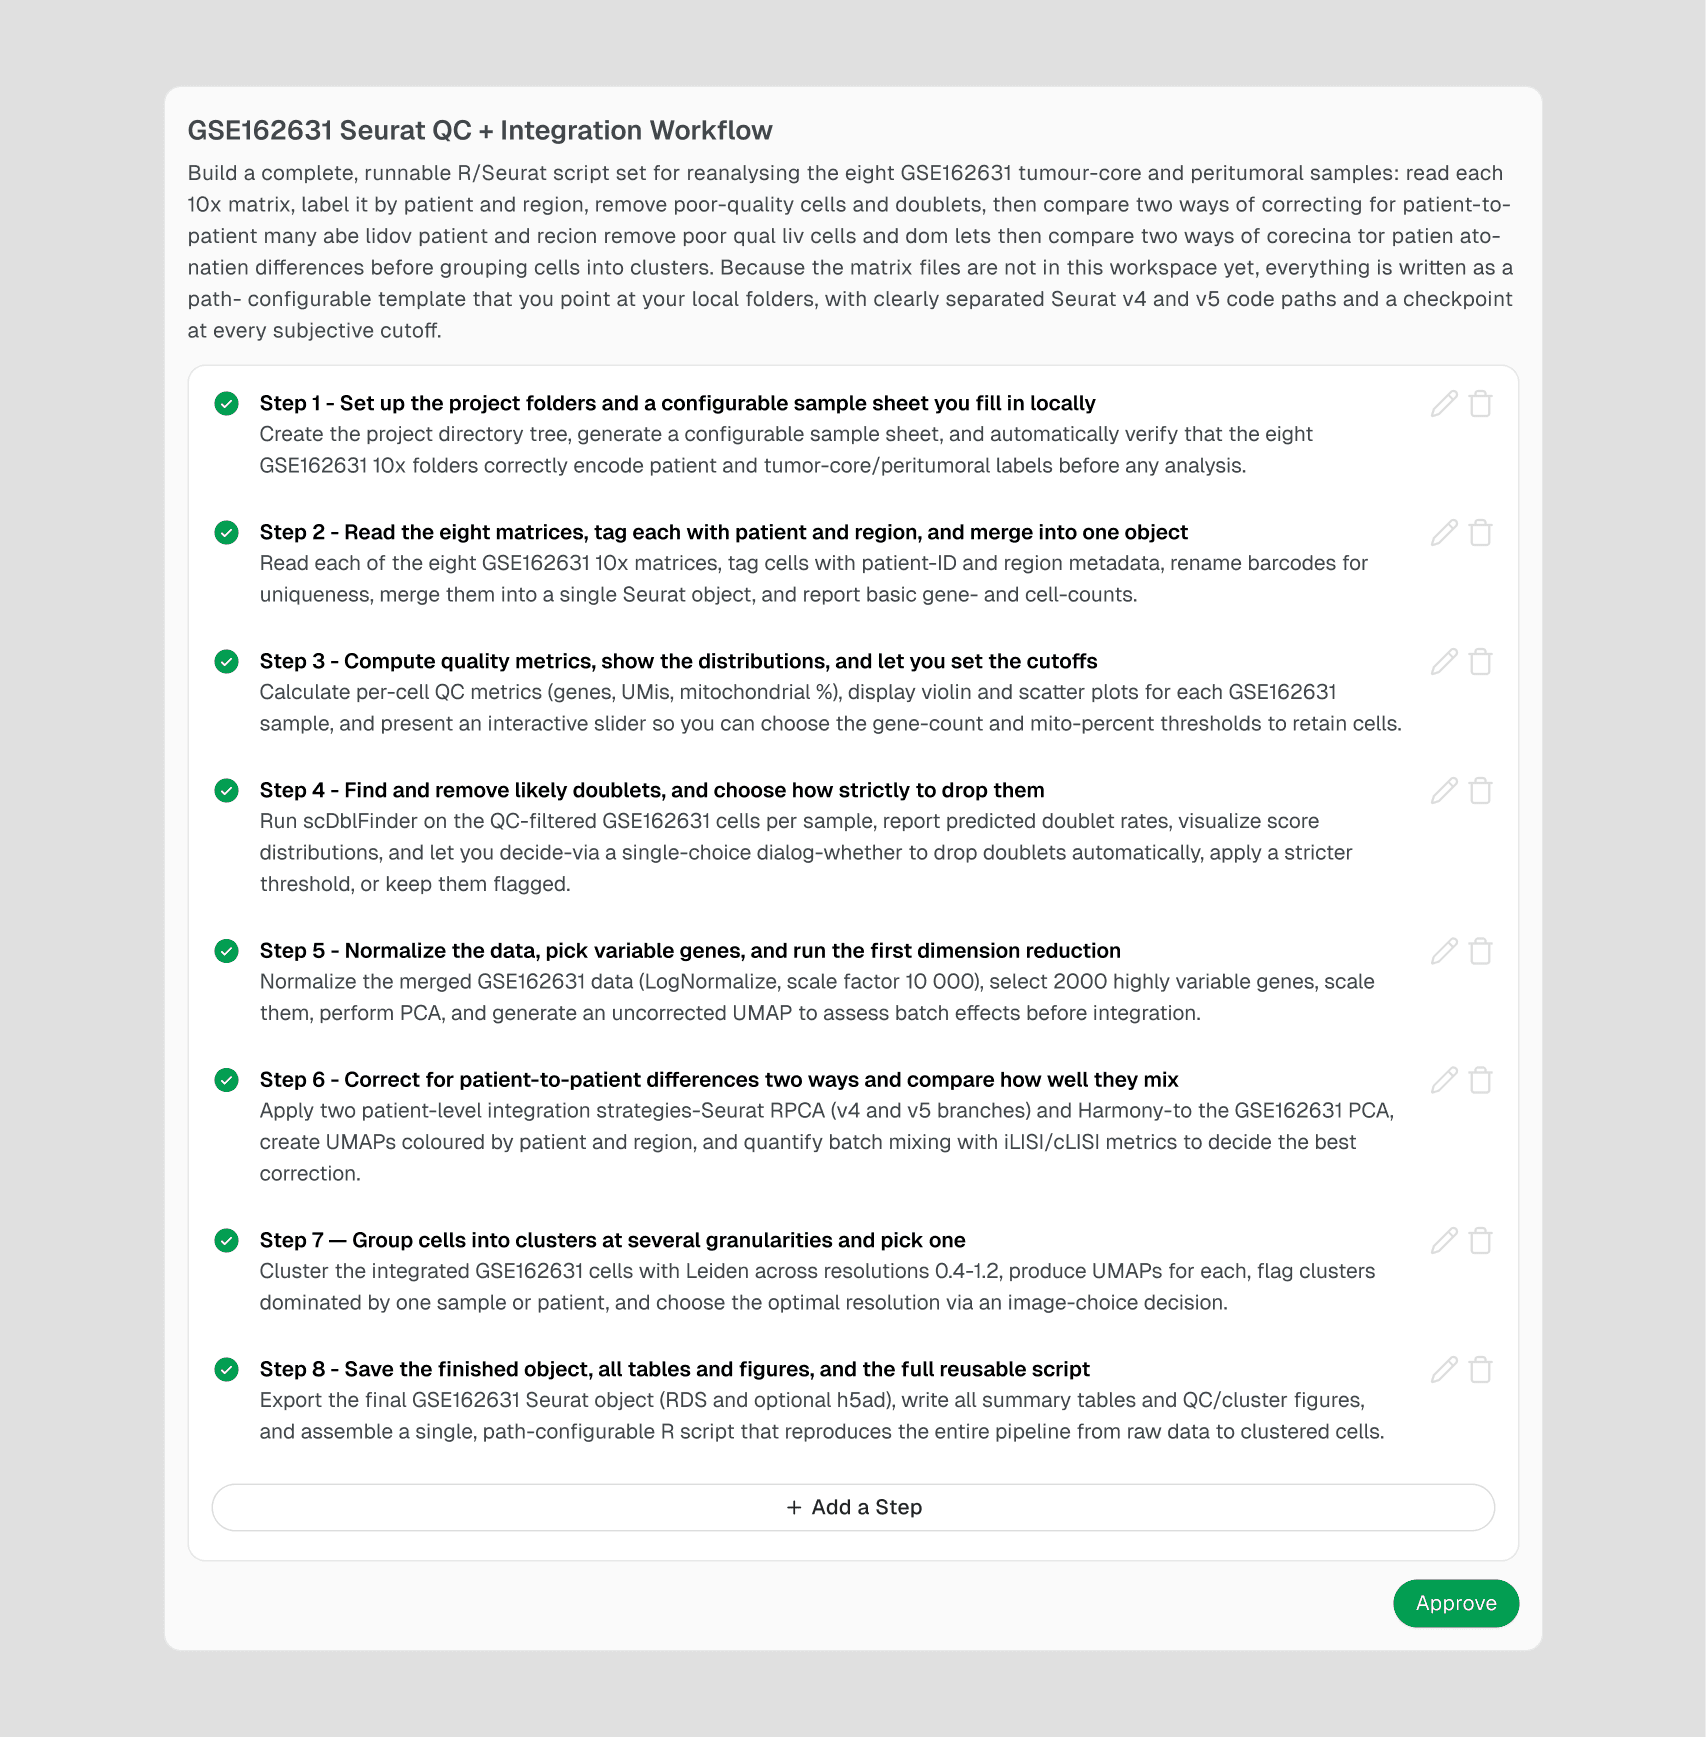
Drylab turns the prompt into seven named steps — from "Read all eight samples, label patient and region, and check data quality" through "Save the finished clustered dataset, code, and summary tables." Read each one; edit or delete a step here if something's off, before any compute runs.
3. Approve — or approve with the recommendation
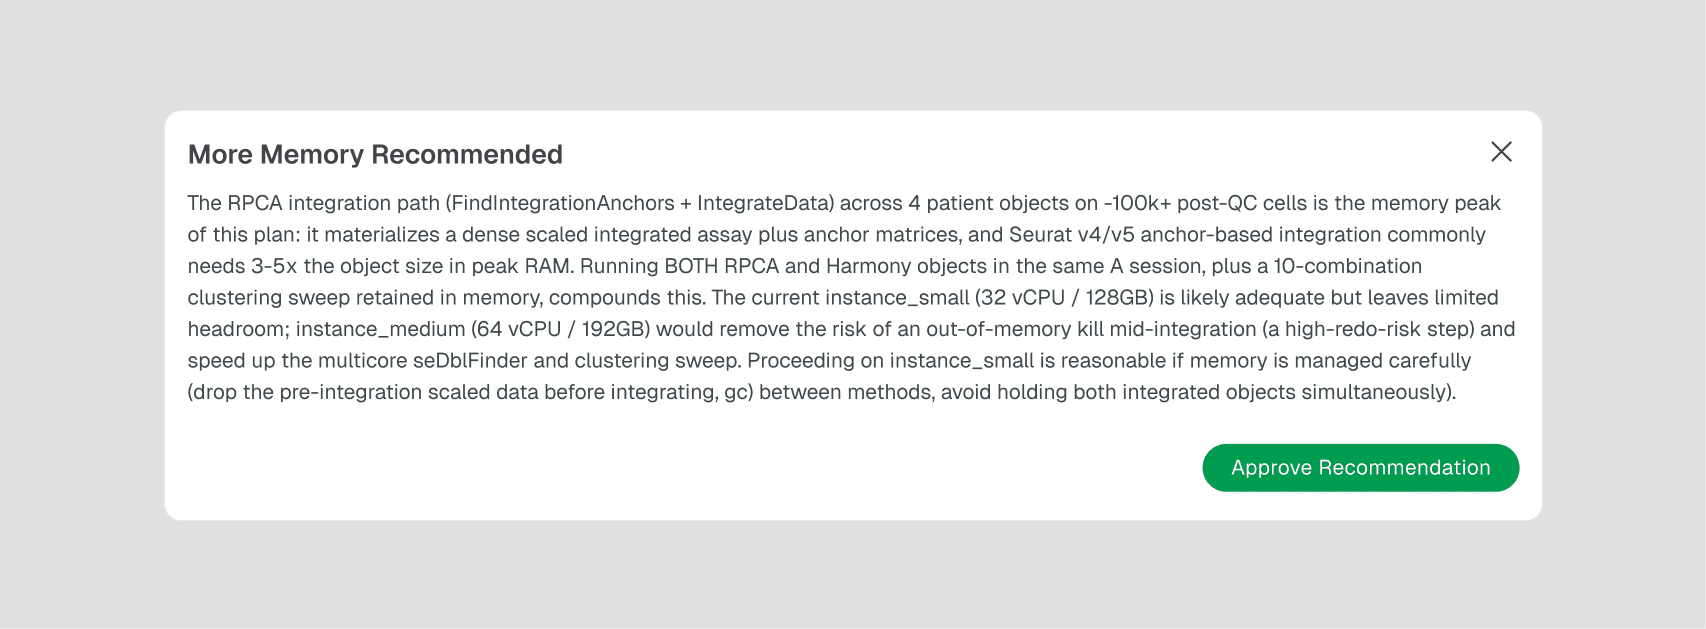
Scroll to the bottom of the plan and Drylab may flag a resource concern before you approve — here, "More Memory Recommended," because running both RPCA and Harmony integration in one session is memory-intensive. Approve Plan runs it as specified; Approve with <recommended instance> takes the recommended instance size. (The screenshot shows an older version of this card, where the button was labelled "Approve Recommendation".)
4. Answer the integration-method clarification question
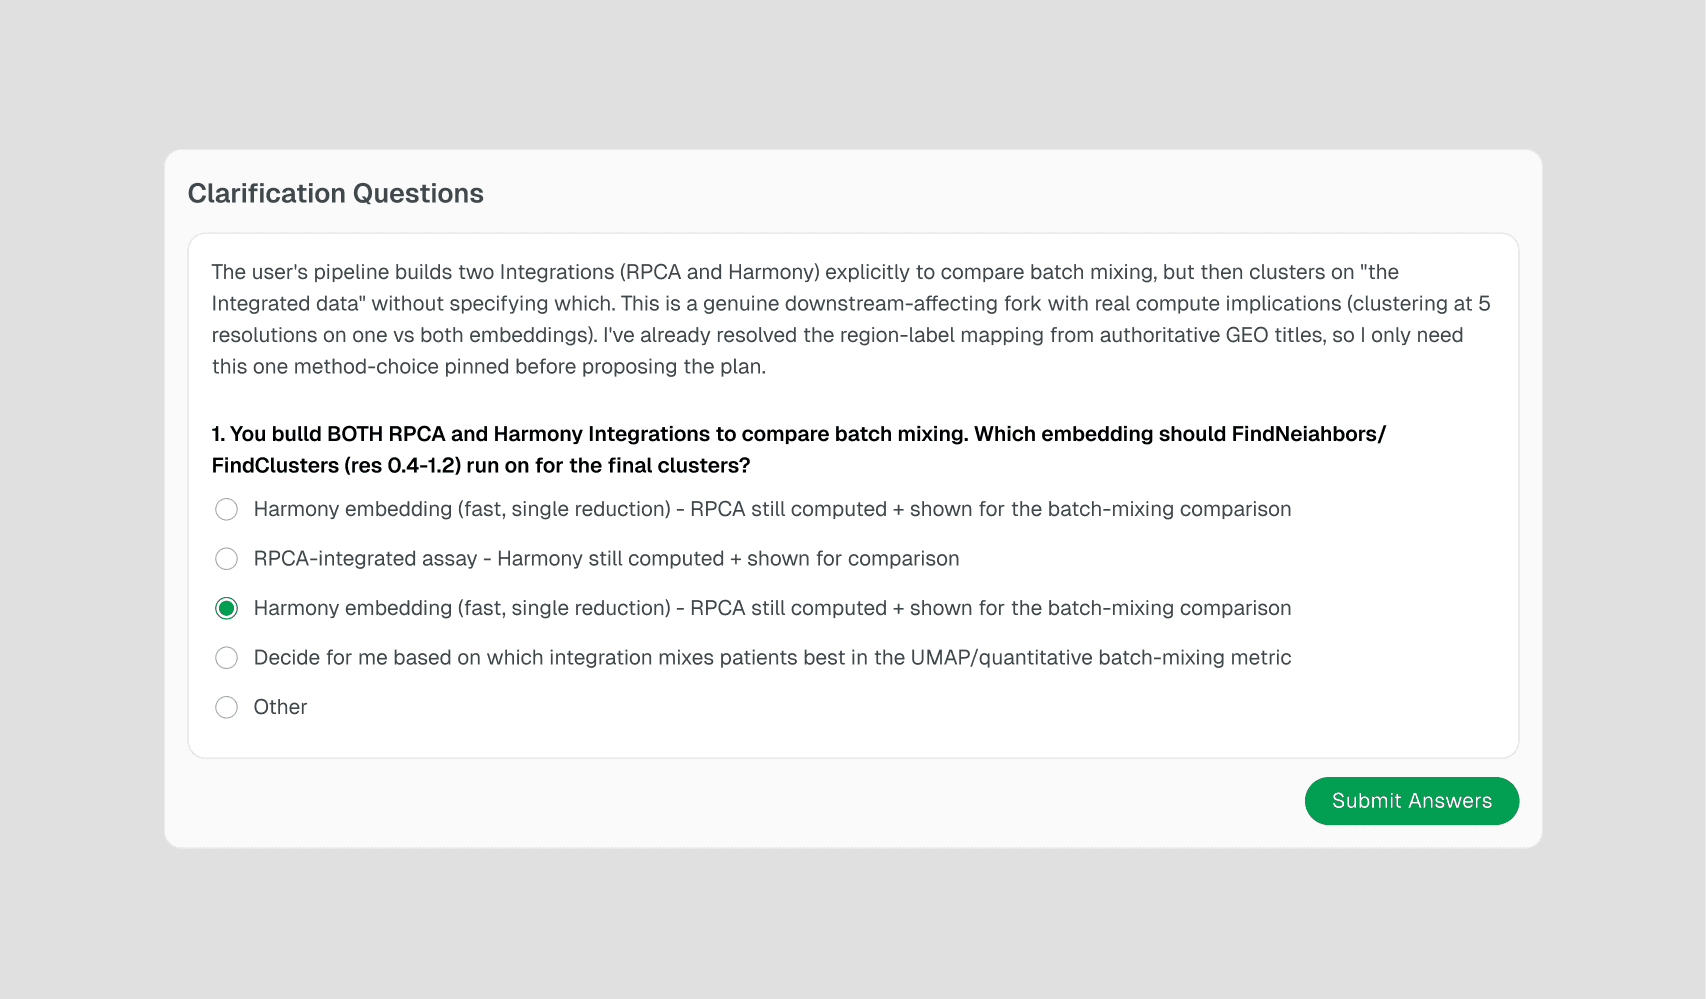
Mid-run, Drylab hits a genuine fork: the prompt asked for both RPCA and Harmony to compare batch mixing, but didn't say which one clustering should run on. It explains the trade-off and offers four options. Here, "Cluster on BOTH and give me two cluster-by-sample tables to compare directly" is selected — getting a direct comparison instead of trusting Drylab's default recommendation.
5. Drag QC thresholds using the live evidence
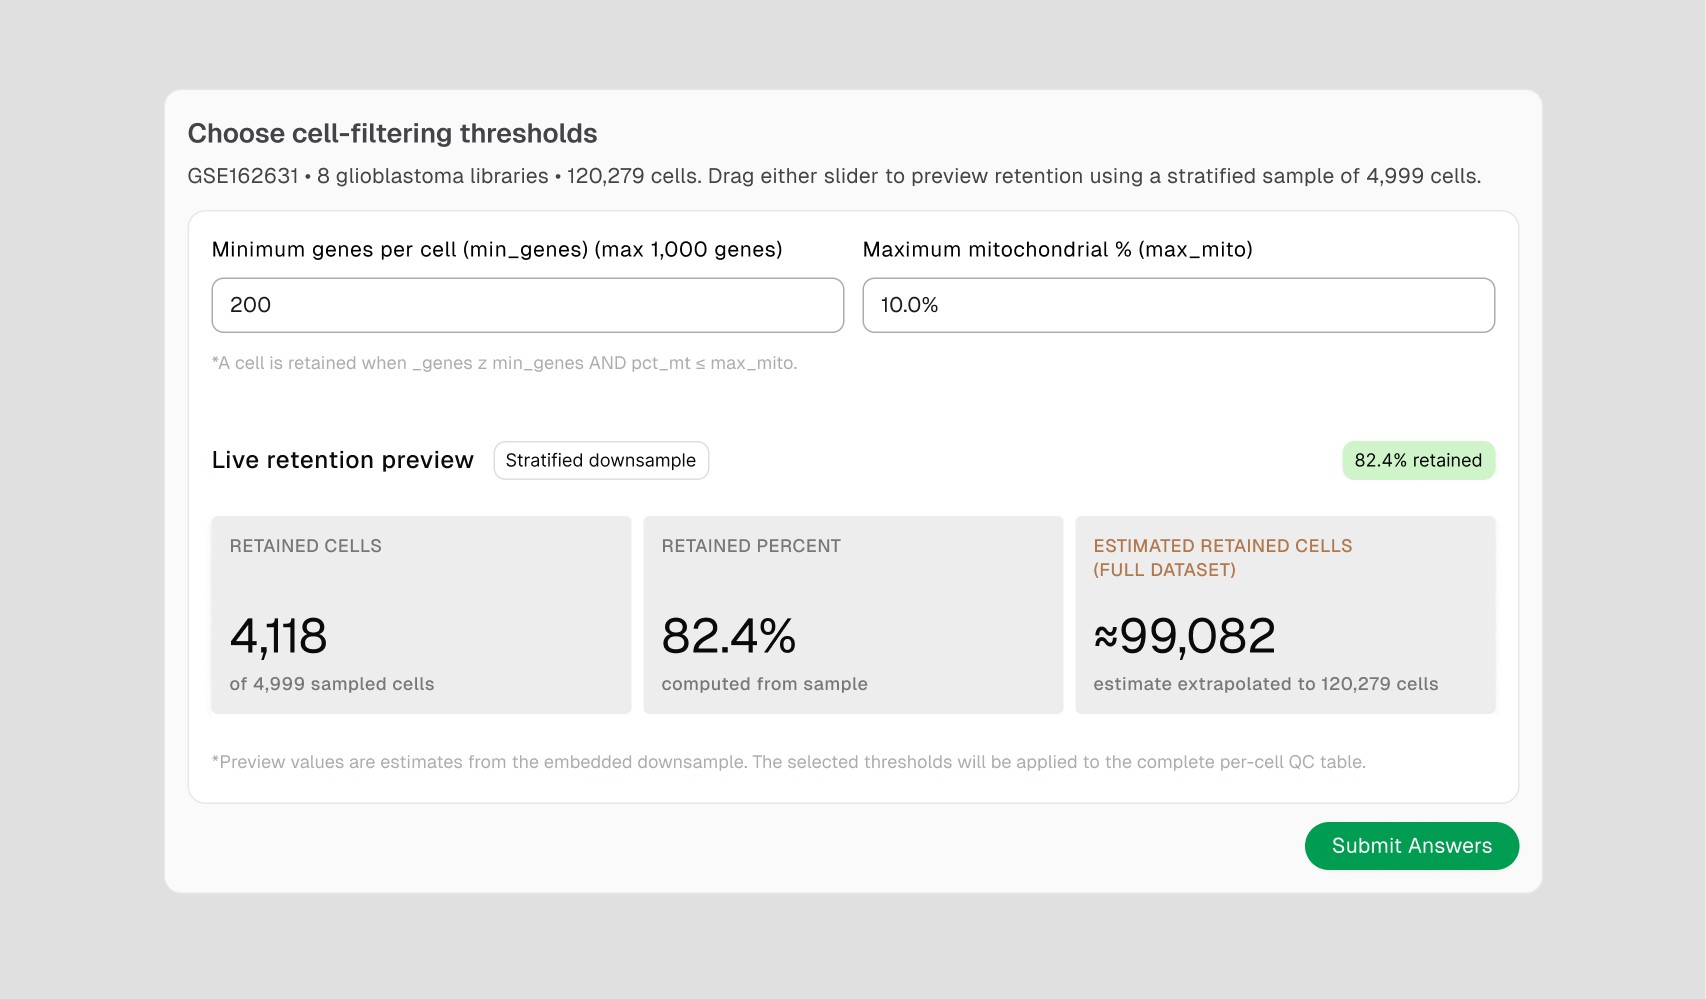
The interactive QC checkpoint pre-fills your requested defaults (200 genes, 10% mito) and shows the consequence immediately: at these defaults, 82.4% of a 4,999-cell stratified sample is retained, extrapolating to ≈99,082 of 120,279 cells. Drag either slider to see the number change before you confirm — no need to re-run to find out.
6. Compare RPCA vs. Harmony and pick a resolution visually
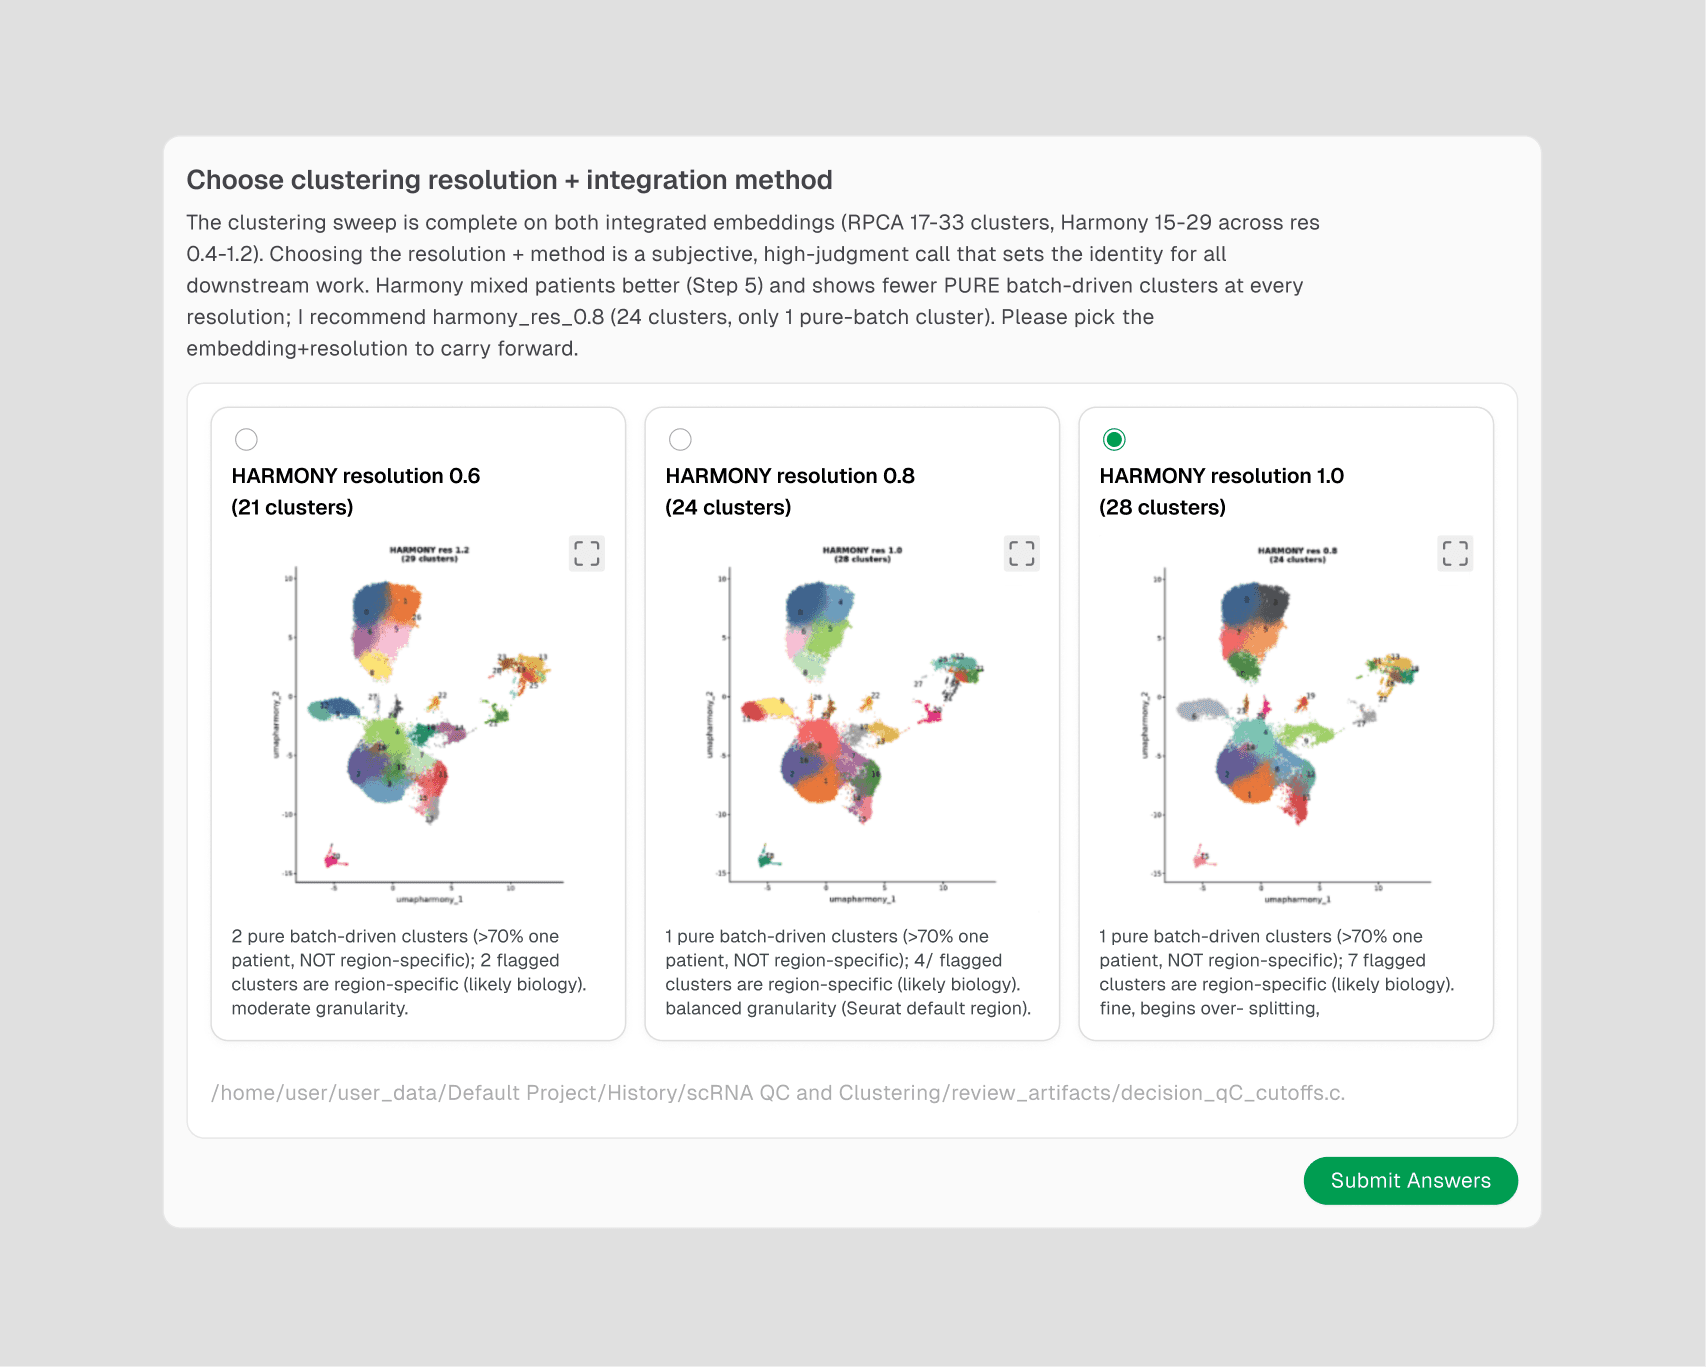
The clustering sweep runs both embeddings across five resolutions each (RPCA: 17–33 clusters; Harmony: 15–29 clusters). Drylab recommends harmony_res_0.8 — 24 clusters, only 1 pure-batch cluster, the fewest of any option — and lays out every candidate UMAP with its batch-driven-cluster count underneath so the recommendation can be checked, not just trusted.
7. Check the provenance table before moving on
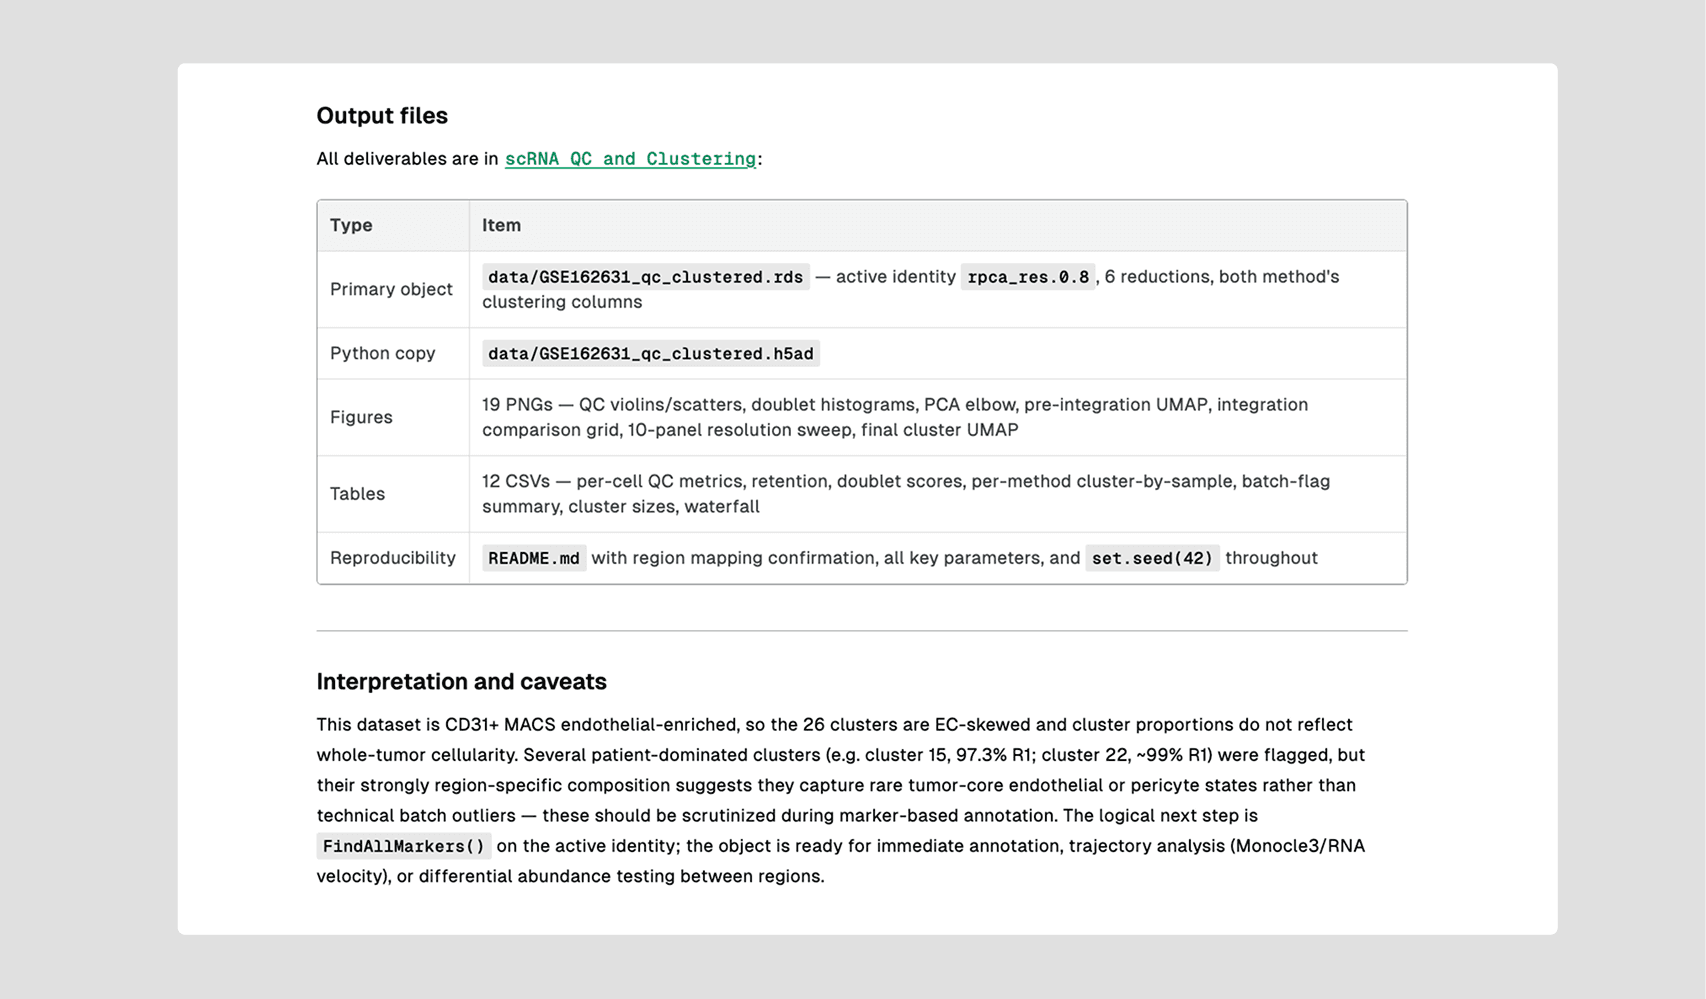
The finished step reports exactly what was produced: the primary .rds object (active identity rpca_res_0.8, both methods' clustering columns retained), a Python-readable .h5ad copy, 19 figures, 12 tables, and a README recording region-mapping confirmation, every parameter, and set.seed(42) throughout. This is what you'd hand to a collaborator, or check six months from now.
Stage 3 — Cell-type annotation
Chain straight into labeling, using the clustered object you just built.
1. Chain into Cell-Type Annotation with your own markers
In the same chat, tag the next workflow and supply canonical markers instead of accepting generic defaults — this is the actual prompt used:
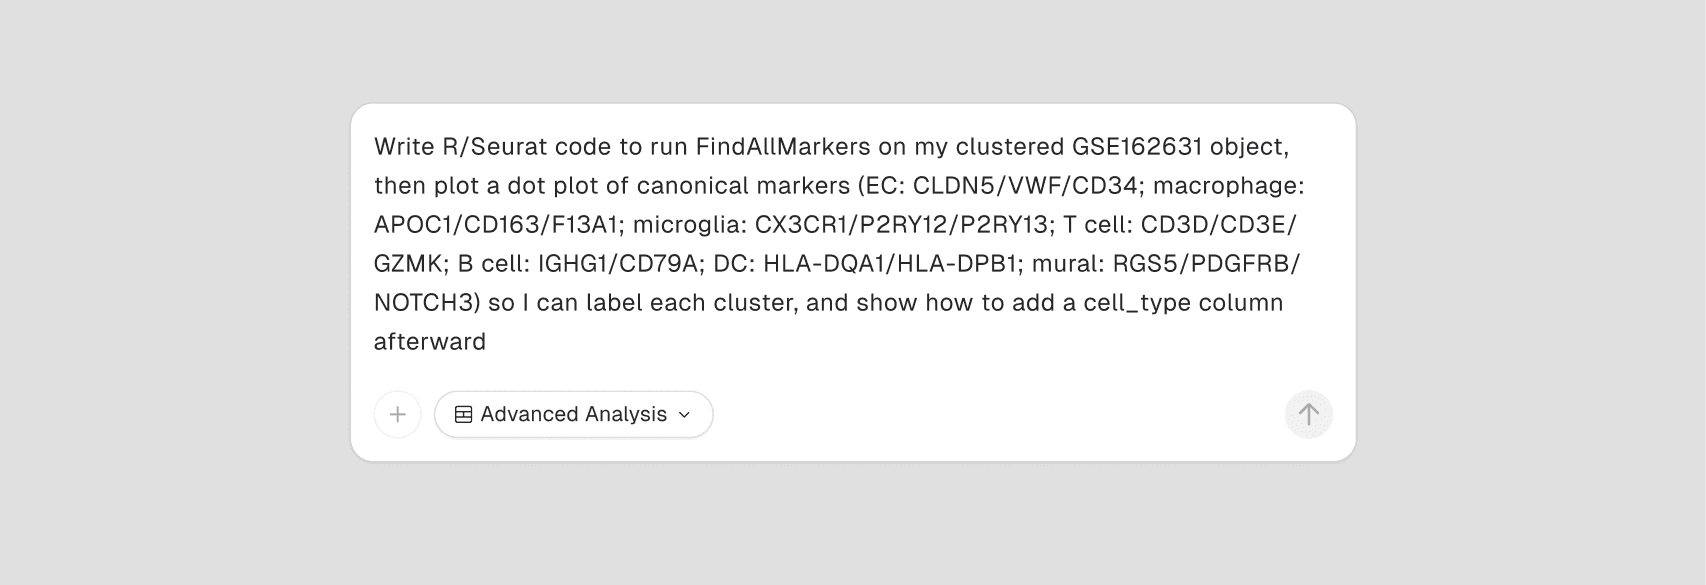
The marker panel is specific to this tumor micro-environment (endothelial, macrophage, microglia, T/B cell, DC, mural). Swap in the marker set for your own tissue - the structure (FindAllMarkers → dot plot → label → cell_type column) stays the same.
2. Confirm cell-type labels against marker evidence
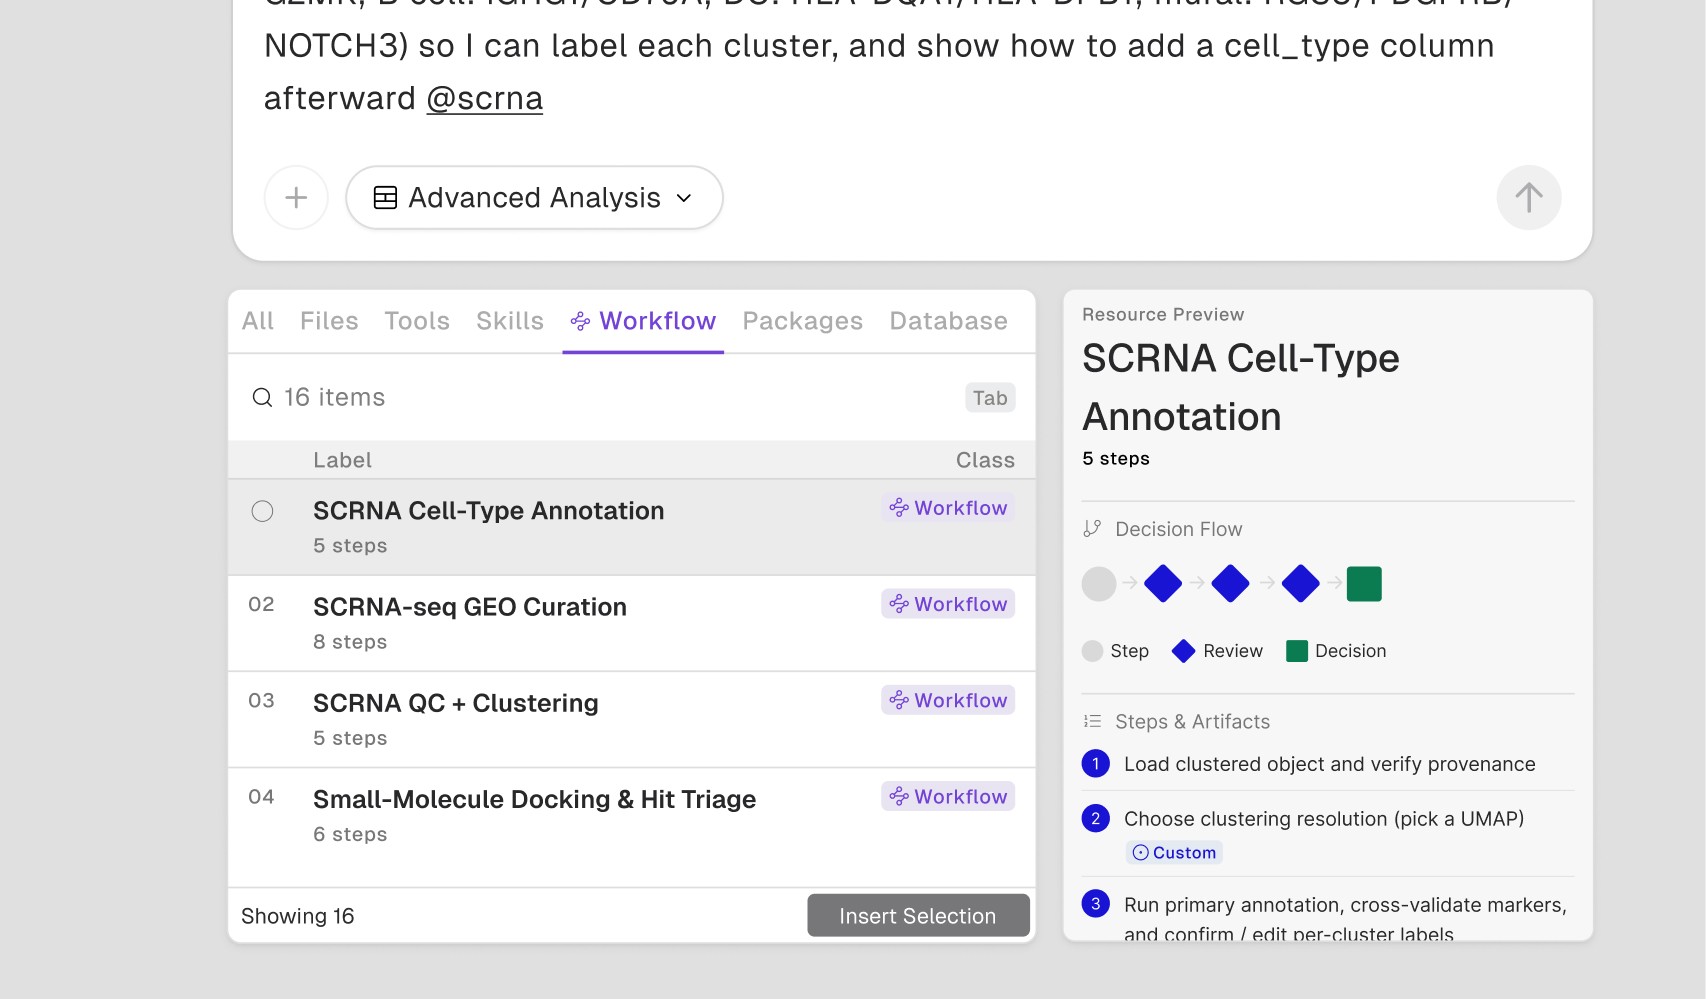
Cell-Type Annotation's own documentation sets expectations: "pick clustering resolution from candidate UMAPs, confirm per-cluster labels against marker evidence, decide which mixed clusters to subcluster, resolve ambiguous/low-confidence calls, and export a provenance-tracked annotated object." Step 3, Run primary annotation, is tagged Table Edit — you'll see a generated label per cluster and can correct any that don't match your marker panel.
3. Decide whether to subcluster mixed populations
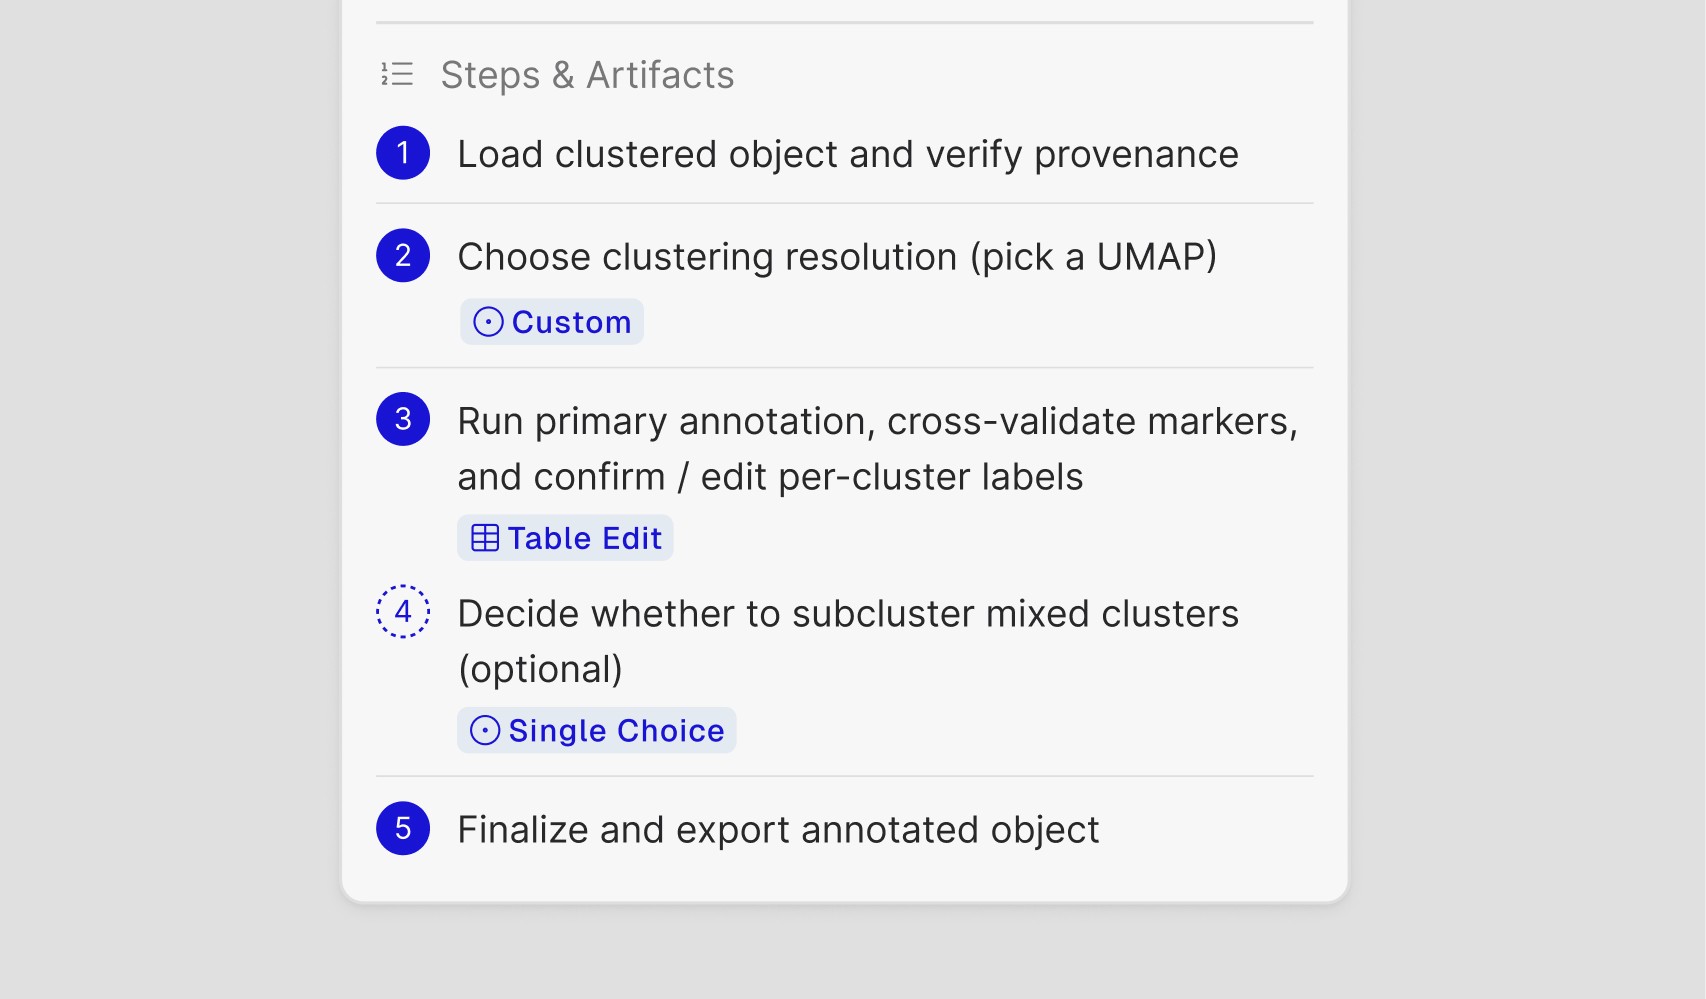
Step 4 is explicitly optional and tagged Single Choice: if a cluster shows mixed marker signal (say, macrophage and microglia markers both present), you decide whether to split it further or accept it as one population. Nothing is subclustered silently - the option surfaces and waits for your call.